By Penny Langford
The global mining sector has hit a structural inflection point. After years of surplus and mid-tier pricing for key battery metals, three demand vectors that were once speculative are now operational and competing for the same core inputs simultaneously: electric vehicle market recovery, the massive expansion of AI data center infrastructure, and global grid modernization. The result is the 2026 Demand Wall — a transition from supply abundance to structural deficit in copper, lithium, and rare earth elements — and with it, a M&A environment where buying existing assets is dramatically cheaper than building new ones.
What Is the 2026 Demand Wall and Why Is This Year the Inflection Point?
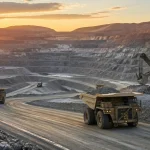
Through 2024 and 2025, the critical minerals market largely absorbed excess supply from earlier production surges. That absorption period is over. Consumption rates now outpace the operational capacity of the world’s tier-one mines, and the leading indicators confirm the shift. S&P Global projects a potential 10 million tonne per year copper shortfall by 2040, but the pressure is already visible in current production economics: existing mines face declining ore grades, forcing operators to process significantly more material just to maintain historical output levels. Capstone Copper is reporting record EBITDA as it ramps production to meet rising demand, but the capacity headroom across the sector is narrowing fast.
In the lithium sector, the shift is even more abrupt. While 2025 carried a surplus that suppressed pricing, Morgan Stanley now forecasts an approximately 80,000-tonne lithium carbonate equivalent deficit in 2026. EVs still account for over 55% of lithium demand, but grid-scale energy storage systems are the swing factor that turned the balance negative. The supply side cannot respond at the pace demand is accelerating. Our analysis of the copper supply crisis and the limits of M&A as a supply solution documents how this structural gap has been building — and why the 2026 inflection was foreseeable years before it arrived.
How Are AI Data Centers Creating a Second Pillar of Critical Mineral Demand?
Electric vehicles were always the headline demand driver for critical minerals. AI infrastructure is the demand driver the market underestimated. AI data centers are significantly more energy-intensive than traditional cloud storage facilities, requiring large quantities of copper throughout their power distribution systems and lithium for uninterruptible power supply infrastructure. The scale of that demand is not marginal — hyperscale AI campuses are among the most copper-intensive construction projects per megawatt that the electrical industry has ever built.
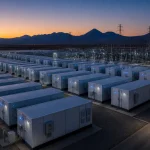
Grid-scale battery storage adds a third layer. As countries move to stabilize grids against the intermittency of renewable energy, the volume of minerals required for stationary storage is growing to rival the automotive sector. This creates the structural floor that makes the demand picture durable: even if EV adoption rates fluctuate in any given quarter, AI infrastructure and grid storage keep baseline demand for copper and lithium structurally elevated regardless of what happens in the automotive market. Our coverage of the AI and energy nexus and the copper price surge driven by AI and grid demand traces how this second pillar has been forming in real time.
What Is Replacement Scarcity and Why Does It Define the 2026 M&A Thesis?
Replacement scarcity describes the widening gap between a mining company’s market capitalization and the actual cost to discover, permit, and build an equivalent asset from scratch. Today, many junior mining companies trade at deep discounts to their net asset value. Sector analysis puts advanced-stage junior developers at approximately 0.51x price-to-NAV — meaning the market prices these companies at roughly half what their verified resources are worth in the ground.
That disconnect is unsustainable in a supply-constrained environment, and majors know it. Acquiring a junior at its current market price — even with a 40–50% takeover premium — costs roughly 70% less than attempting to develop an equivalent project independently from greenfield. Beyond the capital saving, the time-to-market factor has become a critical asset in itself. With project development timelines now stretching 10 to 15 years from discovery to first production, an advanced-stage project that sits only 3 to 5 years from first output is worth far more than its book value. Majors in 2026 are not simply buying pounds in the ground — they are buying time that the market has not yet priced. The dynamics of mining consolidation versus actual supply creation explain why this M&A wave accelerates the ownership of existing resources without adding new tonnes to the market.
Which M&A Deals and Project Types Are Attracting the Most Attention?
The 2026 M&A landscape is dominated by strategic acquisitions rather than traditional sector consolidation. A new class of strategic buyers — automotive manufacturers and defense contractors — is moving upstream to secure supply chains directly rather than relying on spot markets or long-term offtake agreements that depend on project execution they cannot control. This upstream movement competes with mining majors for the same pool of advanced-stage assets.
Projects in stable North American and allied-nation jurisdictions command the highest premiums. Ucore Rare Metals’ resource upgrade at Bokan Mountain in Alaska illustrates the type of domestic asset attracting serious attention as Western governments push to decouple critical mineral supply from high-risk jurisdictions. Government policy is actively compounding strategic asset value: federal backing for critical minerals projects — as seen with domestic uranium production starts — functions as a de-risking mechanism for acquirers and pushes junior valuations higher than pure market economics would deliver. The geopolitical positioning driving Western critical mineral policy and the shifting tide of public mining support both reinforce why government-backed projects carry acquisition premiums that privately financed assets cannot match.
What Does the 2026 Supply-Demand Balance Look Like Across Critical Minerals?
The following table presents the 2026 forecast supply-demand balance across the five most strategically significant critical minerals, comparing estimated 2025 conditions against 2026 projections and the primary demand driver behind each shift.
| Commodity | 2025 Balance (Est.) | 2026 Forecast Balance | Key Demand Driver |
|---|---|---|---|
| Copper | Slight Surplus | −180,000 Tonnes (Deficit) | AI Data Centers / Grid Modernization |
| Lithium (LCE) | Surplus | −80,000 Tonnes (Deficit) | Grid-Scale ESS / EV Recovery |
| Nickel | Surplus | Balanced / Tightening | High-Nickel Battery Chemistries |
| Rare Earths | Tight | Deficit | Defense Systems / EV Motors |
| Uranium | Deficit | Widening Deficit | Small Modular Reactors (SMRs) |
The uranium trajectory deserves particular attention. Uranium entered 2025 already in deficit, and the widening forecast for 2026 reflects accelerating SMR development commitments and the return of nuclear power to mainstream energy policy across the United States, Europe, and Asia. Our uranium supply analysis in the 2026 uranium price forecast documents how AI data centers and SMRs are together driving a new supercycle in a commodity that the market had largely written off a decade ago. The resource nationalism dynamic affecting lithium supply — explored in our coverage of Zimbabwe’s lithium export ban — adds a geopolitical layer to the lithium deficit picture that aggregate supply-demand models alone do not capture.
What Are the Strategic Implications for Mine Operators and Investors?
For mine operators, the priority in 2026 is operational efficiency and life-of-mine extension. The demand wall keeps pricing floors elevated, which rewards operators who maximize throughput from existing assets rather than waiting for new capacity. Declining ore grades at major copper mines mean that maintaining historical output already requires processing more material — squeezing efficiency from existing infrastructure is not optional, it is the margin defence.
For investors, the focus remains on junior developers with permitting-ready assets in stable jurisdictions. The 0.51x P/NAV discount that currently characterises advanced-stage juniors will not persist once supply deficits appear visibly in quarterly production and inventory reporting. As the gap between what the market prices and what the assets are worth becomes undeniable in the data, the current trickle of M&A will become a flood. Traditional commodity exchanges may also cease to reflect the true security-of-supply premium that industrial end-users — automakers, data center operators, defense contractors — are willing to pay for guaranteed non-constrained supply. The replacement scarcity environment is more than a market cycle. It is a fundamental restructuring of how mining assets are valued in a world that needs minerals to build its digital and green future.
Frequently Asked Questions
What is the 2026 Demand Wall in critical minerals?
The 2026 Demand Wall is the structural inflection point where consumption rates for copper, lithium, and rare earth elements exceed the operational capacity of existing tier-one mines. Three simultaneous demand vectors drive the shift: EV market recovery, AI data center expansion, and global grid modernization. S&P Global projects a 10 million tonne copper shortfall by 2040, and Morgan Stanley forecasts an 80,000-tonne lithium carbonate deficit in 2026 alone.
What is replacement scarcity in mining?
Replacement scarcity is the gap between a mining company’s market capitalization and the cost to discover, permit, and build an equivalent asset from scratch. In 2026, advanced-stage junior miners trade at approximately 0.51x price-to-NAV. This means acquiring a junior at a 40–50% premium costs roughly 70% less than developing an equivalent greenfield project independently — and delivers an asset that may be only 3–5 years from production rather than 10–15.
How are AI data centers driving critical mineral demand in 2026?
AI data centers are more energy-intensive than conventional cloud facilities, requiring large copper volumes for power distribution and lithium for uninterruptible power supply systems. Alongside grid-scale battery storage — needed to stabilize grids against renewable intermittency — AI infrastructure creates a structural demand floor that keeps critical mineral consumption elevated regardless of EV adoption fluctuations.
What does the 2026 copper and lithium deficit mean for investors?
Copper moves into a forecast 180,000-tonne deficit in 2026 as AI and grid demand combine with declining ore grades at major producers. Lithium flips from 2025 surplus to an 80,000-tonne LCE deficit driven by grid storage and EV recovery. Both deficits support elevated pricing floors and reinforce the M&A thesis — junior developers with permitting-ready assets become high-value acquisition targets as majors seek faster production routes than greenfield allows.
Which mining M&A deals are most likely in 2026’s replacement scarcity environment?
Strategic acquisitions dominate over traditional consolidation, with automotive manufacturers and defense contractors joining mining majors as upstream buyers. Advanced-stage projects in stable North American and allied-nation jurisdictions attract the highest premiums, particularly those with existing resource upgrades, government backing, or national interest designations that reduce execution risk for acquirers.
What is the commodity outlook across critical minerals for 2026 and beyond?
Copper and lithium enter deficit in 2026. Nickel tightens from surplus toward balance. Rare earths shift into deficit driven by defense and EV motor demand. Uranium widens its existing deficit as SMR development accelerates. Across all categories, a decade of underinvestment in exploration meets a decade of unprecedented technological demand — and the market is only beginning to price the gap.