By Penny Langford

Gold mining costs have moved decisively above the $1,500-an-ounce threshold, marking a structural shift in the economics of producing the metal even as record prices continue to generate exceptional margins.
The World Gold Council reported that global average all-in sustaining costs (AISC) reached $1,785 an ounce in the first quarter, up 5% from the previous quarter and 16% year over year. The increase represented the industry’s 28th consecutive year-on-year rise in AISC, reflecting higher royalties, energy, freight, labor and sustaining capital costs.
The milestone matters because $1,500 an ounce was once viewed as a high-cost level for many established producers. It now sits below the reported global average, while several major and intermediate miners are guiding toward costs between $1,700 and $1,900 an ounce.
At the same time, the gold price has risen much faster than the cost base. The World Gold Council said gold briefly reached $5,595 an ounce in January, while the average quarterly price climbed 17% from the previous quarter and 70% from a year earlier. That widening spread pushed average AISC margins to a record $3,076 an ounce.

The result is a sector with unusually strong cash generation but a higher underlying cost structure. For mine operators, investors and policymakers, the central question is whether the cost increase represents a temporary inflationary surge or a new baseline for gold production.

What AISC includes : and what it does not
AISC is a non-GAAP measure designed to show the cost of maintaining current gold production. The World Gold Council’s AISC guidance includes mine-site operating costs, sustaining capital, sustaining exploration, corporate general and administrative expenses, royalties, production taxes and closure-related expenditures.
By-product credits, such as revenue from silver or copper, can reduce reported AISC. This means comparisons between producers require care. A company reporting costs on a by-product basis may appear more competitive than a producer reporting gold-equivalent costs, even where the underlying operations have similar economics.
AISC also excludes some non-sustaining expenditures. New mines and major expansion projects are generally treated separately when they meet materiality thresholds. The measure should therefore be read as an estimate of the cost to sustain an existing operation, not the full cost of building new production or the same thing as net income.
Companies can also report AISC on a consolidated or attributable basis. The World Gold Council recommends that producers disclose the basis used and provide a reconciliation to their financial statements.
Linkable data table: the cost curve moves higher
| Indicator | Reported or guided level | Why it matters |
|---|---|---|
| Global average AISC | $1,785/oz in Q1 | The industry average is now well above the former $1,500 threshold |
| Year-on-year AISC change | +16% | Costs continue to rise despite strong operating margins |
| Sequential AISC change | +5% | Inflationary pressure accelerated during the quarter |
| Royalty share of average AISC | 12% | Double the approximately 6% share reported in Q1 five years earlier |
| Average AISC margin | $3,076/oz | Gold prices have outpaced cost inflation |
| Torex Gold 2026 AISC guidance | $1,750–$1,850/oz AuEq | A company-level example of costs above the industry milestone |
| Torex 2026 sales guidance | 410,000–460,000 oz AuEq | Higher volumes are expected to offset part of the cost pressure |
Sources: World Gold Council and Torex Gold. Company-level AISC figures are not directly comparable unless the reporting basis, metal mix and by-product treatment are aligned.
Torex Gold’s 2026 guidance illustrates the operating reality. The company expects AISC of $1,750 to $1,850 per gold-equivalent ounce sold at its Morelos Complex, compared with $1,732 per ounce achieved through the first nine months of the prior year.
Torex attributed the increase largely to higher royalties, profit-sharing payments, land-access costs and currency assumptions. Those pressures are partly offset by higher sales and economies of scale as the Media Luna operation moves toward steady-state production.
The comparison also shows why headline cost figures need context. Torex estimates its 2026 AISC on a by-product basis at $1,190 to $1,240 per gold ounce, helped by copper and silver credits. Its gold-equivalent figure is materially higher because it captures the broader metal mix.
Royalties are becoming a larger cost of production
Royalties were the most significant contributor to the increase in global AISC during the first quarter, according to the World Gold Council. Royalty payments rose 24% quarter over quarter and 85% year over year, as producers paid governments a larger share of higher gold revenue.
The shift is especially visible in jurisdictions using sliding-scale royalty systems. Ghana introduced a new royalty structure in March that can reach 12% when gold prices exceed $4,500 an ounce. Burkina Faso and Mali have also implemented higher royalty rates at elevated gold prices.
These policies create an important distinction between gross metal prices and realized operating economics. A higher gold price can increase revenue, but it can also raise royalties, production taxes, employee profit-sharing obligations and land-access payments.
At IAMGOLD’s Essakane mine in Burkina Faso, the World Gold Council said royalty costs rose 220% year over year and represented 35% of cash costs. Resolute Mining also identified higher royalties as a factor pushing costs at its Syama operation above guidance.
For operators, fiscal sensitivity is now as important as grade, recovery and throughput. A mine with a lower nominal AISC may not necessarily deliver stronger free cash flow if its jurisdiction captures more of the price upside.

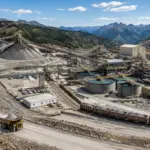
Processing infrastructure is a major source of sustaining capital, energy use and operational cost exposure.
Fuel, freight and consumables add pressure
Geopolitical disruption has compounded the royalty effect. The World Gold Council said the conflict involving Iran and the resulting disruption across the Middle East affected fuel, power, shipping, freight and mining consumables.
Diesel prices in the United States rose 54% during the quarter, while wholesale diesel prices in Perth, Australia, increased 96%. Freight and consumables costs at Gold Fields rose 40% from the start of the conflict.
Explosives, sodium cyanide, maintenance parts and fabricated components have also been affected by higher energy and industrial-material costs. These inputs can move through the supply chain with a delay, meaning the full effect of a disruption may not appear in reported AISC until later quarters.
Larger producers have been better positioned to manage the shock. The World Gold Council noted that some companies used fuel inventories, hedging, power-purchase agreements and long-term procurement contracts to limit short-term exposure. OceanaGold, for example, had hedged around 80% of annual diesel consumption.
Smaller producers and single-asset operators may have less protection. That creates a widening resilience gap within the cost curve, even where headline gold prices support all-in profitability.
Record margins do not eliminate cost risk
The cost increase has not yet undermined sector profitability because gold prices have risen by considerably more. The World Gold Council calculated that average AISC margins reached $3,076 an ounce, up 25% sequentially and 134% year over year.
Higher-cost producers also benefited. Margins at the 90th percentile of the cost curve rose 32% quarter over quarter to $2,363 an ounce.
That cash flow is reshaping capital allocation. Newmont returned $2.7 billion to shareholders after generating quarterly free cash flow of $3.1 billion and approved an additional $6 billion share-buyback program. AngloGold Ashanti generated approximately $1.2 billion in free cash flow and moved from a net-debt position into net cash.
However, margins calculated as gold price less AISC are not equivalent to net earnings. Taxes, financing costs, corporate investments, non-sustaining capital, working capital movements and one-time charges can reduce final cash available to shareholders or fund expansion.
The operating risk is asymmetric. If gold remains above $4,000 an ounce, producers may continue to generate strong cash flows even with AISC near $1,800. If prices decline while fuel, labor, royalties and maintenance costs remain elevated, margins could compress more quickly than the headline cost ratio suggests.
Gold mining outlook: base, bull and bear cases
| Scenario | Gold-market assumptions | Cost assumptions | Likely industry response |
|---|---|---|---|
| Base case | Gold remains historically high but trades below its peak | AISC rises moderately as royalties and consumables remain elevated | Prioritize debt reduction, sustaining capital and selective brownfield growth |
| Bull case | Geopolitical risk, central-bank demand and investment flows push prices higher | Energy and supply-chain costs stabilize | Increase shareholder returns, accelerate exploration and compete for quality assets |
| Bear case | Stronger dollar, higher real rates and weaker investment demand pressure gold | Costs remain sticky near recent highs | Defer marginal projects, preserve liquidity and reduce discretionary spending |
The World Gold Council’s 2026 gold outlook emphasizes that macroeconomic and geopolitical conditions will determine whether prices remain rangebound or move materially higher. Central-bank demand, recycling and investment flows remain important variables.
For mine planners, the base case should remain the most useful framework. It assumes gold prices stay supportive but does not treat the first-quarter margin as permanent. Projects that work only at record prices may face greater scrutiny, particularly where they require high initial capital or depend on complex permitting and infrastructure.
What operators and investors should monitor
The $1,500 threshold is now less useful as a simple dividing line between low- and high-cost producers. Decision-makers should instead track how each company’s cost structure responds to changes in price, volume and jurisdiction.
Key indicators include:
- AISC excluding and including by-product credits.
- Royalty and production-tax sensitivity.
- Sustaining capital per ounce.
- Fuel and power hedging coverage.
- Production volume and throughput assumptions.
- Free-cash-flow conversion after sustaining capital.
- Debt reduction and capital-return commitments.
- Exposure to labor, freight and consumable shortages.
The industry has crossed a meaningful cost milestone, but the stronger conclusion is broader: gold mining is becoming more expensive to sustain even as it becomes more profitable at current prices.
That combination creates room for debt repayment, dividends, automation, exploration and selective M&A. It also raises the standard for capital discipline. Producers that use today’s exceptional margins to improve operating resilience may be better positioned than those that treat high gold prices as a permanent replacement for cost control.
For additional coverage, see Skillings’ gold mining news and analysis, gold mining record-margin analysis and mining investment outlook.
Shareable social snippets
LinkedIn: Gold mining’s global average AISC reached $1,785 an ounce in the first quarter, moving decisively above the $1,500 milestone. Royalties, energy, freight and sustaining capital are rising, but record gold prices still generated a reported $3,076-an-ounce average margin. The strategic test is whether producers convert that cash into stronger balance sheets and more resilient operations.
X: Gold-mining AISC reached $1,785/oz in Q1, up 16% year over year. Royalties now account for 12% of average costs, but record prices still pushed average margins to $3,076/oz. The next test: cost discipline after the windfall. #GoldMining #MiningNews #Gold #MiningFinance

Real-time operational data can help mines manage cost volatility across haulage, processing and energy systems.