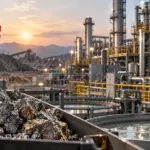
Battery-material refining capacity is becoming as important as mine output in supply-chain risk assessments.

By Penny Langford | Operation 100K deep-dive
The critical minerals supply chain is entering 2026 with a structural imbalance: mining is becoming more geographically diverse, while refining, chemical conversion and component manufacturing remain concentrated in a small number of countries.
That distinction matters for battery makers, automakers, miners and investors. A new mine outside China may add tonnes to global resources, but it does not necessarily reduce exposure to Chinese processing, licensing requirements, technology or export controls.
The International Energy Agency’s critical minerals outlook estimates that the top three refining countries controlled about 86% of supply for key energy-transition minerals in 2024, up from roughly 82% in 2020. China was the leading refiner for 19 of the 20 minerals assessed, with an average share of about 70%.

The result is a supply chain in which the main risk is no longer simply whether mineral-bearing rock can be mined. It is whether material can be separated, converted into battery-grade chemicals, qualified by customers and shipped across borders without regulatory interruption.

Export controls have moved downstream
China’s April 4, 2025 announcement was a clear marker of this shift. Under Announcement No. 18 of 2025, the Ministry of Commerce and General Administration of Customs placed export controls on products containing samarium, gadolinium, terbium, dysprosium, lutetium, scandium and yttrium.
The measures covered more than concentrates. They included metals, alloys, oxides, compounds, permanent-magnet materials and related products. Exporters must apply for licenses and identify controlled items in customs declarations.

China expanded the rare-earth framework in October 2025 to include additional elements and a broader range of products, equipment and technologies. The USGS Mineral Commodity Summaries 2026 records that the October expansion was suspended for one year, while the April controls remained in effect and selected exporters began receiving general licenses.
The wider October package also placed greater attention on lithium-ion batteries, artificial graphite anode materials and battery production equipment. The IEA’s analysis of export controls describes the development as part of a broader increase in restrictions affecting critical-mineral trade.
For battery manufacturers, this changes the compliance question. It is no longer sufficient to know where a mine is located. Companies must also establish:
- Where the material was refined and converted.
- Which technology and equipment were used.
- Whether Chinese-origin inputs are embedded in intermediate products.
- Whether an export license is required at the point of shipment.
- Whether customers can qualify an alternative source before an interruption occurs.

Graphite anode supply is exposed to both geographic concentration and processing qualification risk.
The critical minerals map is different at every stage
The production data show why supply-chain exposure cannot be measured using mine output alone. The following table compiles 2025 estimates from the USGS Mineral Commodity Summaries 2026 and highlights the difference between mining concentration and downstream dependence.
| Material | 2025 world mine production | Leading producing region | U.S. 2025 import position | Main supply-chain chokepoint |
|---|---|---|---|---|
| Lithium | 290,000 tonnes lithium content | Australia: 92,000 tonnes; China: 62,000 tonnes | More than 50% net import reliance | Chemical conversion and battery-grade qualification |
| Cobalt | 310,000 tonnes cobalt content | DRC: 230,000 tonnes, about 74% | 79% net import reliance | DRC export quotas and concentrated refining |
| Nickel | 3.9 million tonnes nickel content | Indonesia: 2.6 million tonnes, about 67% | 41% including scrap; nearly 100% excluding scrap | Indonesian ore policy and Class 1 conversion |
| Natural graphite | 1.8 million tonnes | China: 1.4 million tonnes; about 82% in USGS commentary | 100% net import reliance | Anode-grade purification and export licensing |
| Rare earths | 390,000 tonnes REO equivalent | China: 270,000 tonnes, about 69% | 67% for compounds and metals | Separation, heavy rare earths and magnets |
Figures are 2025 estimates. Units and definitions differ by commodity and are not directly comparable.
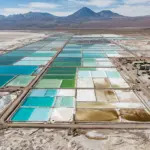
The regional picture is particularly important for investors. Australia and Chile remain major lithium producers, while Argentina is expanding quickly. Yet much of the world’s lithium chemicals are still processed in China. The USGS lithium chapter estimates 2025 mine production at 92,000 tonnes in Australia, 56,000 tonnes in Chile, 62,000 tonnes in China and 23,000 tonnes in Argentina.
That is a diversified mining map, but not necessarily a diversified battery-material map.
Graphite presents an even sharper example. The United States produced no natural graphite in 2025 and consumed an estimated 71,000 tonnes. China accounted for an estimated 82% of global natural graphite production, while the U.S. remained 100% reliant on imports. The constraint is not simply access to graphite ore; it is the availability of purified, spherical and coated material suitable for anodes.
Indonesia and the DRC add producer-country risk
The supply chain is also being reshaped by policies in major producing countries.
Indonesia’s nickel strategy remains focused on domestic processing. The country has banned unprocessed nickel ore exports since 2020 and is now using annual production approvals to manage domestic feedstock. Reporting cited by market and government sources places the 2026 nickel ore quota in a range of roughly 250 million to 270 million wet tonnes, compared with about 379 million tonnes approved for 2025.
Projected Indonesian smelter demand is higher, at approximately 327 million to 350 million tonnes, depending on the source and operating assumptions. That creates a potential domestic ore gap of about 50 million to 100 million tonnes before considering imports.
For operators, the immediate exposure is feedstock availability. For investors, it is the possibility that Indonesia’s policy will support nickel prices but also reduce utilization at higher-cost smelters or delay new capacity.
The DRC has taken a similar approach in cobalt, though through export controls rather than mine quotas. The country suspended cobalt exports in February 2025 after prices fell amid oversupply. In October, the ban was replaced with export quotas of 18,125 tonnes for the remainder of 2025 and up to 96,600 tonnes per year in 2026 and 2027.
The USGS cobalt data estimates that the DRC supplied 230,000 tonnes of mined cobalt in 2025, or approximately 74% of global output. The new quota is therefore significant even if production continues at the mine site. Material can accumulate in-country while international users face tighter availability.
That is the difference between geological supply and tradable supply.

Cobalt and nickel supply risks are increasingly shaped by export policy and domestic processing requirements.
What the shift means for mine developers
The supply-chain changes create a higher bar for new projects. A technically viable mine may not be commercially strategic unless it can deliver a qualified product into a resilient processing route.
Operators should assess four milestones before relying on a project’s headline resource:
- Conversion route: Can the project produce a battery-grade chemical, or only an intermediate concentrate?
- Customer qualification: Have cathode, anode or precursor customers tested the material at commercial scale?
- Logistics and licensing: Can the product move through ports, jurisdictions and customs systems without a single-country dependency?
- Technology provenance: Does the process rely on equipment, intellectual property or reagents that may become subject to export controls?
Permitting and infrastructure remain part of this equation. Skillings’ reporting on critical-minerals permitting under FAST-41 illustrates how schedule certainty can affect financing and construction decisions. A faster federal permitting timetable can improve project planning, but it does not solve metallurgy, offtake, water, power or downstream qualification risk.
The same logic applies to lithium. The USGS lithium outlook estimates global resources at about 150 million tonnes of measured and indicated lithium, with reserves of approximately 37 million tonnes. The constraint is converting those resources into consistent production at the required grade and cost.
Skillings’ lithium market analysis examines why brine chemistry, recovery rates, project timing and energy-storage demand may matter more than resource size alone.
2026 base, bull and bear scenarios
The following framework is a planning tool rather than a price forecast. It focuses on physical availability, policy execution and the effect on operators and capital providers.
| Scenario | Supply-chain conditions | Operational implications | Investor implications |
|---|---|---|---|
| Bear | Export controls remain selective; suspended measures are not materially expanded; new lithium, nickel and graphite capacity ramps close to schedule | Better feedstock availability, lower urgency for alternative suppliers and weaker pricing power | Higher pressure on marginal projects and processing assets; valuation remains focused on cost position and execution |
| Base | Export licensing remains unpredictable; Indonesia maintains tighter nickel approvals; DRC cobalt quotas hold; diversification projects progress slowly | More inventory buffers, dual sourcing and customer qualification; periodic delays for graphite, cobalt and rare-earth products | Premium for permitted, financeable projects with offtake and processing access; greater working-capital requirements |
| Bull | Export controls broaden or suspended measures are reactivated; storage demand accelerates; major projects miss ramp-up targets | Physical shortages, higher conversion margins and greater competition for qualified material | Stronger pricing for exposed commodities, but also higher policy, substitution and demand-destruction risk |
The base case is the most useful for planning because it does not require a full supply shock. Even selective licenses and intermittent delays can raise costs when customers need qualified material rather than generic tonnes.
The key metric is delivered, qualified supply
The critical minerals market is moving from a mine-centric model to a chain-of-custody model. Investors will increasingly need to distinguish between resources, production capacity, operating output and material that can be delivered to a qualified customer.
That creates opportunities for projects in Australia, North America, Latin America, Africa and Southeast Asia. It also raises the cost of entry. New supply must often include refining, recycling, traceability, logistics and customer qualification to reduce exposure to existing bottlenecks.
For operators, the practical priority is to map dependencies at every processing stage. For investors, the relevant question is not simply how many tonnes a project can produce. It is whether those tonnes can reach the battery, magnet or industrial customer without passing through a single regulatory or processing chokepoint.
The IEA’s 2026 outlook points to the same structural conclusion: diversification is progressing, but slowly. Until new conversion capacity is built and qualified, export controls will continue to shift risk downstream: from mines and reserves to refineries, anode plants, cathode facilities and final manufacturers.
LinkedIn snippet
Critical-minerals risk is moving downstream. China’s refining dominance, Indonesia’s nickel controls and the DRC’s cobalt quotas show why mine output alone is no longer enough to measure battery supply security. Our Operation 100K deep-dive maps the regional statistics, policy milestones and base/bull/bear scenarios shaping 2026.
X snippet
Critical-minerals supply risk is shifting from geology to processing. China dominates key refining stages, Indonesia is tightening nickel approvals and the DRC is capping cobalt exports. The 2026 question: how much qualified battery material can reach customers without a single-country chokepoint?