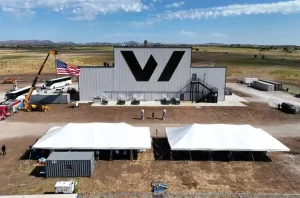
Copper cathode inventory and warehouse infrastructure are becoming central to price formation as tariff uncertainty reshapes regional flows.

SKILLINGS MINING INTELLIGENCE
By Charles Pitts | Mining Investments
Copper’s retreat from its late-August record is testing whether mining valuations can convert exceptional commodity prices into durable net asset value.
LME copper is around US$14,152 a tonne, while Comex copper is near US$6.40 a pound, down from the late-August record of US$6.7775/lb. The pullback follows a sharp build in US inventories, where Comex stocks have reached approximately 675,185–688,000 tonnes after 46 consecutive days of inflows.
More Read

The central issue for operators and investors is no longer simply whether copper is in short supply. It is whether the market is pricing a temporary tariff-driven dislocation or a lasting structural repricing of copper assets.

That distinction matters for P/NAV multiples, acquisition premiums, royalty payback periods and the assumptions used to value new mines.
Market snapshot
| Commodity | Reference price | Market signal |
|---|---|---|
| Gold | US$4,315–4,328/oz | Lower as US rate-hike odds rise above 70%; 30-year Treasury yield exceeds 5.28% |
| Silver | US$64.00–64.60/oz | Down from approximately US$66.40/oz as precious-metals momentum softens |
| Copper | US$14,152/t LME; US$6.40/lb Comex | Pullback from record levels as traders price a potential refined-copper tariff |
| Comex copper stocks | 675,185–688,000 tonnes | Near record levels after 46 straight days of inflows |
| Zinc | US$3,887/t | Firm industrial backdrop, with supply and treatment-charge risks in focus |
| Nickel | US$16,610/t | Indonesian water shortages linked to El Niño could cut Morowali output by 30–40% |
| Uranium | US$89.50/lb futures | Term-market tightness continues to support contracting interest |
| Lithium carbonate | US$22,981/t China | Supply risk rising as Albemarle negotiations continue in Chile |
| Brent crude | Approximately US$95/bbl | Higher on US–Iran escalation and geopolitical risk |
| Iron ore | US$97.70/t | Stable bulk-commodity reference despite uneven steel demand |
Reference levels are indicative market figures and are not intended for trading purposes.
More Read

Copper tariff test: the P/NAV read-through
The prospective US tariff path is the most important near-term variable for copper valuation.
The current market is positioning for a potential 15% tariff on refined copper imports from January 2027, rising to 30% in 2028. The Section 232 decision window around September 30 is therefore being treated as a policy catalyst, even though the final scope and timing remain subject to government action.
The tariff has already changed the location of metal. Copper has flowed toward the United States, lifting Comex inventories while tightening availability outside the US. That has created a regional arbitrage between Comex and LME pricing:
- Comex: elevated by expected US scarcity and front-loaded imports.
- LME: still supported by constrained global supply, but more exposed to the possibility of a flow reversal.
- Ex-US markets: vulnerable if US-bound metal returns to Europe or Asia after a tariff is delayed or rejected.
The result is that the Comex record is not a pure demand signal. It reflects stockpiling, trade positioning and the value of having copper in the correct warehouse before a potential tariff takes effect.
CRU’s 2026 market view has also shifted. Its earlier projected surplus of 639,000 tonnes has been cut to a market that is now described as “balanced at best.” That adjustment reflects disruptions, slow mine growth, tight concentrate availability and stronger power-infrastructure demand.
Goldman Sachs expects copper to end 2026 near US$13,735/t, below the current LME reference but still historically elevated. Skillings’ wider scenario framework is:
| Copper case | Indicative range | Main conditions |
|---|---|---|
| Bear | US$10,000–11,500/t | Tariff risk fades, inventories unwind, mine supply and scrap increase |
| Base | US$12,000–13,500/t | Market remains tight but Comex dislocation eases |
| Bull | US$14,000–15,500/t | Tariffs persist, disruptions deepen and grid demand accelerates |
For miners, a higher copper price deck can increase NAV quickly. However, an asset’s P/NAV may still compress if investors raise discount rates for trade risk, permitting delays, capital inflation or uncertain regional pricing.
A producer with US-linked sales could benefit from a domestic premium. A mine selling into Asian or European markets may not capture the full Comex price. That makes jurisdiction, product form and offtake structure increasingly important to valuation.
Skillings’ earlier copper price forecast coverage examines the inventory, backwardation and supply risks behind the current price range.
Featured M&A social snippet
LinkedIn: The copper market is testing more than commodity forecasts. Comex inventories near record levels, a possible 15% refined-copper tariff in 2027 and the Anglo-Teck merger are forcing investors to reassess P/NAV, regional pricing and the value of secure production.
X: Copper’s record has exposed a valuation question: can miners turn tariff-driven prices into durable NAV? Our latest Skillings Mining Intelligence examines Comex-LME arbitrage, Anglo-Teck, royalty cash flow and the next P/NAV reset.
M&A intelligence: scale, integration and timing
The approximately US$50–53 billion Anglo-Teck transaction remains the sector’s most important copper consolidation event.
Under the proposed structure, Anglo American shareholders would own 62.4% of the combined company and Teck shareholders 37.6%. The agreement includes a US$4.5 billion special dividend for Anglo shareholders, with payment timing extended to within 45 days of the merger’s effective date.
The strategic value is concentrated in Chile. The combination brings Anglo’s interest in Collahuasi together with Teck’s Quebrada Blanca operations, creating the possibility of infrastructure, logistics and operating integration. The companies have cited a potential annual underlying EBITDA uplift of approximately US$1.4 billion, alongside additional copper production over the longer term.
Glencore’s position at Collahuasi adds complexity. Market attention has focused on the company’s reported hard bargaining over the integration structure and the allocation of benefits. That issue illustrates a broader M&A point: headline ownership does not automatically translate into immediate operational control or synergy capture.
Other transactions point to the same preference for strategic fit:
- OceanaGold and Ausgold’s Katanning activity reflects interest in defined Australian gold growth.
- Boliden’s Nexa transaction expands exposure to zinc and silver and reshapes regional processing logic.
- Wheaton’s Antamina stream shows continued competition for long-life, producing assets with strong operator backing.
The wider Skillings mining M&A coverage tracks the shift toward transactions that combine reserve replacement, infrastructure synergies and commodity security.
Royalty and streaming deals: cash flow with less operating exposure
Royalty companies are benefiting from investor demand for commodity exposure without direct exposure to mine-level capital costs.
Vox Royalty’s agreement to acquire a 2.0% NSR royalty on the White Dam gold mine in South Australia for A$5 million in cash is a useful example. The heap-leach operation was restarted by Broken Hill Gold in April 2026 after historical production of approximately 180,000 ounces at reported cash costs below A$1,000/oz.
The royalty covers roughly 400 square kilometres of tenure and includes gold and copper exposure. Its optionality extends beyond current production: White Dam North has produced a high-grade gold and copper sulphide discovery, while a 25,000-metre drilling program is underway.

Heap-leach infrastructure can provide royalty companies with near-term cash flow and exploration upside across a broad tenure package.
The key valuation questions are straightforward:
- How much cash is paid upfront?
- What production profile supports the royalty?
- How quickly can the investment be recovered?
- Does the royalty include step-down, buyback or expiry provisions?
- How much additional value comes from exploration success?
Ecora Royalties’ first-half results show the operating leverage of a broader portfolio. Portfolio contribution rose 75% year over year to US$31.3 million, while adjusted earnings increased 509% to US$19.5 million. The company also tripled its interim dividend to 1.90 cents per share.
Orogen Royalties’ Triple Flag-funded project-generator acquisitions, including Toro de Oro and El Gigante, offer another model: royalty-company capital can fund exploration while preserving exposure to discoveries that may later be advanced by larger operators.
The valuation gap remains significant:
| Company group | Indicative P/NAV | Primary valuation driver |
|---|---|---|
| Royalty and streaming companies | 1.2–2.0x | Diversified cash flow and limited direct operating costs |
| Senior producers | 0.75–1.1x | Reserve life, balance sheet and execution |
| Juniors | 0.3–0.6x | Exploration success, financing and permitting |
| Recent M&A clearing range | Near 0.73x | Asset quality and confidence in deliverable NAV |
The royalty and streaming finance model remains attractive, but a premium multiple is justified only when cash flows are diversified, contracts are durable and the underlying operators can deliver production.
Lithium: separating a supply shock from a durable recovery
Lithium carbonate in China is around US$22,981/t, but the market remains more balanced than copper.
Albemarle’s Chilean labor dispute has introduced a near-term supply risk. Workers at the Salar de Atacama operation voted 97% in favor of strike action, but the walkout has been suspended for five working days while compulsory mediation proceeds.
A full disruption would not necessarily remove all Chilean lithium supply immediately, but it could affect brine processing, shipment schedules and downstream customer confidence. The key distinction for investors is between a temporary interruption and a durable reduction in operating capacity.

Salar de Atacama’s evaporation ponds illustrate the scale and geographic concentration of Chilean lithium production.
Lithium scenarios should therefore be framed as follows:
- Base case: Prices remain rangebound as Chinese supply restarts offset steady battery demand.
- Bull case: Labor disruption, project delays and stronger energy-storage demand tighten the market.
- Bear case: Restarting capacity and new conversion output keep prices below the level needed to support marginal projects.
A spot recovery is not the same as a structural rebalancing. Investors should monitor project-level costs, conversion capacity, inventory, contract pricing and the pace of new supply before treating higher prices as a permanent change in lithium economics.
Commodity outlook and investor checklist
Gold has eased toward US$4,315–4,328/oz as rising US rate-hike odds and a 30-year Treasury yield above 5.28% reduce the appeal of non-yielding assets. Goldman Sachs still sees gold reaching approximately US$4,900/oz by the end of 2026, but that estimate has been revised down from US$5,400/oz. The bank continues to cite central-bank demand as a long-term support.
Silver’s decline toward US$64.00–64.60/oz reflects higher volatility, while uranium futures near US$89.50/lb continue to contrast with a tighter term market. Nickel faces weather-related Indonesian supply risks, and zinc remains sensitive to smelter economics and mine availability.

Operating data, production guidance and project milestones remain essential inputs to valuation alongside commodity prices.
Investor checklist
- Stress-test copper NAVs at US$12,000–13,500/t, not only at spot prices.
- Separate Comex stockpiling from underlying global copper consumption.
- Monitor the Section 232 decision window and the potential 2027–2028 tariff path.
- Review whether miners can capture regional copper premiums through their product and offtake structure.
- Assess Anglo-Teck’s ability to convert Collahuasi–Quebrada Blanca synergies into cash flow.
- For royalty deals, calculate upfront cost, payback period, effective metal price and operator risk.
- Treat a P/NAV discount as a signal to investigate assumptions, not as proof of undervaluation.
- Track Albemarle mediation, lithium inventory and the timing of supply restarts.
- Compare gold forecasts with real yields and central-bank purchasing.
- Follow uranium term contracting, Indonesian nickel disruptions and zinc treatment charges.
The investment case across mining is increasingly about the quality of cash flow rather than the direction of the commodity tape. Copper remains the favored industrial metal, but the tariff test will determine how much of its current price strength becomes durable value for producers, developers and royalty holders.
This newsletter is for information and market analysis only. It does not constitute financial advice or a recommendation to buy or sell any security.
Lithium Power Map Presale
Get the 2026 Lithium Power Map for $59: Access the presale.