


When the World Nuclear Association reported that long-term uranium contract price indicators reached US$96.50 per pound of triuranium octoxide (U3O8) at the end of August 2026—and held that level through September 30—the nuclear fuel market crossed a threshold that had stood since the 2007–2008 peak of US$95.00 per pound. In a conventional commodity cycle, an 18-year record in term pricing would coincide with expanding equity valuations across primary producers. Instead, uranium mining shares have moved sharply in the opposite direction.

On October 23, 2026, the Global X Uranium ETF (NYSE Arca: URA) touched an intraday 52-week low of US$33.36 before closing at US$34.11, a 45.2 percent decline from its January 29, 2026 intraday 52-week high of US$62.28 (Investing.com). Measured across the last trading-day close of each month (since January 31, February 28, and May 31, 2026 fell on weekend non-trading days, whereas uranium price observations are published as calendar month-end indicators), URA’s monthly closing price series fell 38.0 percent from its Friday, January 30, 2026 close of US$54.99 to its Friday, October 23 close of US$34.11, though it remained above its December 2025 close of US$42.73 through August.
Understanding why uranium equities have retreated while term contract prices sit at record highs requires separating three pricing mechanisms: the spot market for prompt material, the multi-year term contract indicator compiled by UxC and TradeTech, and the lagged realized price schedules embedded in producer contract books. Unlike gold or copper, uranium does not trade on an open futures exchange with daily warehouse warrants. Roughly three-quarters of global utility procurement occurs through private bilateral term contracts spanning three to fifteen years, whereas the spot market covers about 25 percent of trade and is dominated by financial intermediaries and traders, who account for 60 to 70 percent of spot turnover (World Nuclear Association).
Cameco Corporation’s monthly price series from January through September 2026 establishes the divergence between spot trading and utility term contracting. After peaking at US$94.28 per pound on January 31, 2026, the month-end spot price fell to US$86.95 in February, US$84.25 in March, US$86.35 in April, and a trough of US$84.18 in May, before recovering to US$85.00 in June, US$86.38 in July, US$89.68 in August (a directly published Cameco observation, not an interpolation), and US$89.63 on September 30. Across those same nine months, the long-term price indicator rose without interruption: from US$89.00 per pound in January to US$90.00 in February, US$91.50 in March and April, US$94.00 in May, US$95.50 in June and July, and US$96.50 in August and September (Cameco Corporation). While spot fell 4.9 percent over those nine months, term indicators rose 8.4 percent.
Chart 01 & Cameco Realized-Price Sensitivity
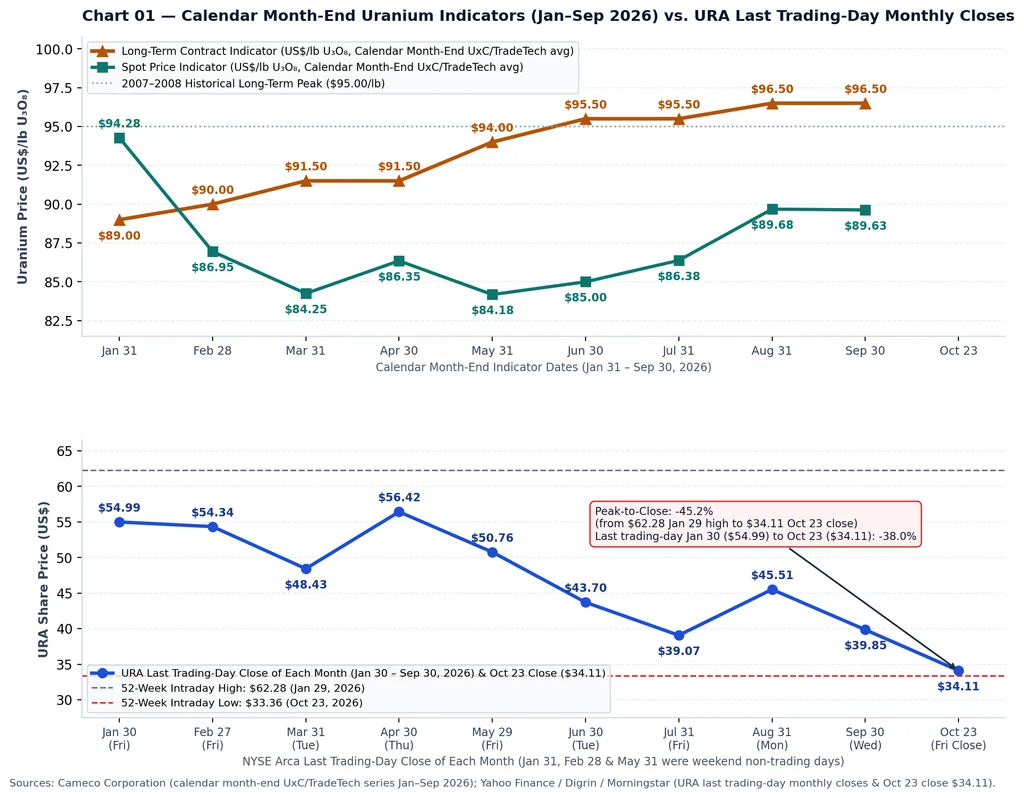
Why have equity investors discounted major producers when term prices are setting records? When UxC and TradeTech publish a US$96.50 per pound long-term indicator, that figure reflects base-escalated floors or fixed schedules negotiated today for deliveries starting two to five years in the future. It does not re-price pounds delivered in 2026 under legacy commitments signed between 2018 and 2023.
More Read

Cameco’s published uranium price sensitivity table as of June 30, 2026 quantifies this multi-year earnings lag. Cameco holds finalized commitments requiring delivery of an average of approximately 28 million pounds per year from 2026 through 2030—roughly 140 million pounds across that five-year window—within a wider multi-decade long-term contract portfolio totaling approximately 230 million pounds, with delivery volumes weighted higher in 2026–2028 than in 2029–2030 (Cameco Sensitivity Page; 24/7 Wall St.). While Cameco explicitly warns that its sensitivity table is not a price forecast, the model shows how its finalized contract portfolio reacts to spot changes. For 2026, if spot uranium averages US$80 per pound, Cameco’s modeled realized price is US$66 per pound; if spot doubles to US$160 per pound, the modeled 2026 realized price rises by just three dollars to US$69 per pound (Cameco Sensitivity Table). At US$100 per pound spot, modeled realized pricing is US$67 per pound in 2026, rising to US$74 in 2027, US$80 in 2028, US$85 in 2029, and US$88 in 2030. Only by 2030 does a shift from US$80 to US$160 spot lift modeled realized prices from US$76 to US$106 per pound.

Strict currency discipline is also required when reading Cameco’s financial statements, which are reported in Canadian dollars, against US-dollar market benchmarks. In its Q2 2026 Form 6-K filing (furnished July 31, 2026), Cameco raised its 2026 consolidated revenue outlook to C$3,320 million–C$3,570 million and lifted its expected average realized uranium price guidance to C$91.00–C$96.00 per pound (up from C$85.00–C$89.00 per pound) across 29 to 32 million pounds of deliveries (ProCap Insights). In Q2 2026, Cameco’s realized price was C$93.13 per pound (US$67.79 per pound). At Cameco’s US$1.00 to C$1.36 exchange rate, C$91.00–C$96.00 per pound equals US$66.91–US$70.59 per pound—aligned with its US-dollar sensitivity table and US$26 to US$30 per pound below the US$96.50 term indicator.
Short-term operational costs have also weighed on 2026 earnings. Because Cameco’s 2026 owned production guidance of 19.5 to 21.5 million pounds is below its 29 to 32 million pound delivery schedule, it bridges the gap through market purchases, inventory, and product loans (4.0 million pounds drawn as of June 30) (Q2 2026 Form 6-K). A US$5 per pound spot increase lifts 2026 revenue by C$14 million but reduces adjusted net earnings by C$2 million and cuts cash flow by C$12 million. In Q2 2026, a 15 percent year-over-year output drop to 3.9 million pounds pushed produced-and-purchased cash costs up 36 percent to C$62.21 per pound and lowered adjusted net earnings to C$77 million, while C$559 million remains held as security in its Canada Revenue Agency tax dispute.

Physical fundamentals explain why utilities still pay US$96.50 for term supply. Globally, 440 operable reactors (405 GWe) require 69,000 tonnes of uranium (81,000 tonnes U3O8) annually, rising in the WNA Reference Scenario to 449 GWe in 2030 and 746 GWe (over 150,000 tU) by 2040, with UxC estimating 3.1 billion pounds of uncovered utility demand through 2045 (Thematic Alpha). Primary mines supplied 60,213 tU in 2024, and Kazatomprom cut its 2026 nominal output forecast by 10 to 17 percent amid sulfuric acid constraints (Investing News Network).
What development would materially change this article’s conclusion? A drop in the UxC/TradeTech long-term price indicator below US$85.00 per pound paired with utility contract deferrals would signal genuine demand deterioration, whereas Q3–Q4 2026 disclosures showing accelerated 2028–2030 ceiling repricing and stabilizing unit costs at Key Lake and JV Inkai would confirm that equity weakness was a temporary duration lag.
Three Key Takeaways (Uranium)
- Record Term Prices vs. Equity Drawdown: Calendar month-end long-term uranium contract indicators reached an 18-year high of US$96.50/lb U3O8 in August and September 2026 (surpassing the 2007–2008 peak of US$95.00/lb), whereas the Global X Uranium ETF (URA) fell 45.2 percent from its January 29, 2026 intraday high (US$62.28) to its October 23 close (US$34.11), or 38.0 percent across last trading-day monthly closes from Friday, January 30 (US$54.99) to October 23.
- Contract Portfolio Lag Explains Near-Term Earnings Inelasticity: Cameco’s June 30, 2026 price sensitivity table (~28 million lbs/yr committed for 2026–2030, or ~140 million lbs over those five years, within a wider ~230 million lb long-term contract portfolio) demonstrates that doubling the assumed spot price from US$80/lb to US$160/lb lifts modeled 2026 realized prices by just US$3/lb (from US$66/lb to US$69/lb), whereas 2030 modeled realized prices expand from US$76/lb to US$106/lb as legacy contracts roll off.
- Currency Discipline & Market Purchases: Cameco reports financials in Canadian dollars (2026 realized price guidance raised in Q2 2026 to C$91.00–C$96.00/lb, or ~US$66.91–US$70.59/lb at C$1.36/US$1.00), and because 2026 owned production (19.5–21.5M lbs) trails delivery commitments (29–32M lbs), a US$5/lb spot increase reduces 2026 adjusted net earnings by C$2 million and cash flow by C$12 million due to higher market purchase costs.
Sources
- Cameco Corporation — Uranium Price Series (Jan–Sep 2026): https://www.cameco.com/invest/markets/uranium-price
- Cameco Corporation — Uranium Price Sensitivity Table (as at June 30, 2026): https://www.cameco.com/invest/markets/uranium-price-sensitivity
- Cameco Corporation Q2 2026 Form 6-K SEC Filing Summary (July 31, 2026): https://www.stocktitan.net/sec-filings/CCJ/6-k-cameco-corp-current-report-foreign-issuer-85b37242cf50.html
- World Nuclear Association — Uranium Markets (Updated Oct 23, 2026): https://world-nuclear.org/information-library/nuclear-fuel-cycle/uranium-resources/uranium-markets
- Global X Uranium ETF (URA) Quote & 52-Week Range — Morningstar: https://www.morningstar.com/etfs/arcx/ura/quote
- Global X Uranium ETF (URA) Monthly Closing Price History — Digrin: https://www.digrin.com/stocks/detail/URA/price
- Kazatomprom 2026 Production Cut — World Nuclear News: https://www.world-nuclear-news.org/articles/kazatomprom-to-lower-uranium-production-in-2026