Stacked silver bars beside photovoltaic wafers and industrial electrical contacts.

By Penny Langford
Silver closed at US$64.15 an ounce on Sept. 16, up 0.45% on the day, while gold ended at US$4,352.40. The move extended one of the sharpest advances in silver’s modern trading history: from roughly US$30 in early 2025 to more than US$64.
The unusual feature is not only the size of the rally. It is that silver has continued to hold elevated levels despite a clear monetary headwind.
The Federal Reserve raised its policy rate by 25 basis points on Sept. 16 in a unanimous 12-0 vote, taking the target range to 3.75%-4%. The Fed’s projections also showed 16 of 18 policymakers expecting at least one more increase in 2026. Higher rates and real yields typically weigh on non-yielding precious metals.

Silver has absorbed that pressure because the market is being pulled in two directions at once. Monetary policy is restrictive, but physical availability remains tight. Industrial demand continues to draw metal into solar, electrification and electronics, while investment demand has strengthened. The result is a market increasingly sensitive to inventory movements, fund flows and changes in fabrication demand.

Silver market reference points
The figures below are indicative market reference points, assembled from the supplied Sept. 16 spot data, Silver Institute research, LBMA benchmark information, COMEX market data and reporting from Kitco. Silver prices can differ by venue, timing and contract specification.
| Reference point | Indicative level or description | Why it matters | Primary source |
|---|---|---|---|
| Spot silver | US$64.15/oz | Current price anchor after a sharp multi-year advance | [Market data supplied for Sept. 16] |
| Early 2025 starting level | About US$30/oz | Shows the scale of the rally and the risk of volatility | Market reference |
| Spot gold | US$4,352.40/oz | Provides the denominator for the gold/silver ratio | [Market data supplied for Sept. 16] |
| Gold/silver ratio | About 68:1 | Silver has outperformed gold, but the ratio remains above several historical extremes | LBMA silver price information |
| Industrial demand | Solar PV, electronics, autos, data centers, grid infrastructure and electrification | Industrial use is the largest structural demand pillar | Silver Institute outlook |
| Supply mix | About 70%-75% by-product of lead-zinc, copper and gold mining | Silver supply cannot quickly respond to a silver-price signal alone | Silver Institute/World Silver Survey |
| Deficit run | Sixth consecutive annual deficit expected | Above-ground inventories must help close the gap between supply and demand | Silver Institute; Kitco report |
The deficit estimates have shifted as the year’s demand assumptions changed. The Silver Institute’s February outlook cited a projected 67 million-ounce deficit, while later World Silver Survey reporting cited by Kitco put the estimate at 46.3 million ounces. The difference reflects revisions, particularly around photovoltaic demand and recycling. The broader conclusion is unchanged: the market is expected to remain in deficit for a sixth straight year.
More Read

Why the deficit is supporting prices
A deficit does not automatically produce a straight-line rally. Silver can remain in deficit while prices fall if inventories are ample, investment demand weakens or fabricators reduce consumption. What has changed is the market’s cushion.
The Silver Institute says above-ground stocks have been drawn down through consecutive shortfalls. LBMA vault holdings and registered COMEX inventories are therefore important indicators of how much readily deliverable metal is available when investors or manufacturers increase purchases. The LBMA’s benchmark is administered independently by ICE Benchmark Administration, while COMEX futures and warehouse data are published through CME Group.
A smaller inventory buffer makes the price more responsive to new demand. It also increases the potential for regional premiums, higher lease rates and abrupt moves between futures and physical markets. That does not guarantee a squeeze, but it raises the market’s sensitivity to investment flows.
Silver’s rally has also benefited from investment demand. The Silver Institute forecast physical investment to rise in 2026, while Kitco reported that coin and bar demand and exchange-traded product flows were becoming increasingly important in determining the market balance.

Photovoltaic wafers and electrical contacts represent silver’s largest industrial demand debate.
Solar demand is both a support and a risk
Solar manufacturing illustrates the central tension in the silver outlook.
Photovoltaic installations continue to expand, and silver is used in conductive pastes and electrical contacts. Electrification, data-center construction, automotive electronics and grid investment are also supporting demand across several industrial applications.
But higher silver prices create an incentive to use less of the metal in each cell. Manufacturers are thrifting silver loadings, and some are testing or adopting alternative materials, including copper-based solutions. The Silver Institute expects industrial fabrication to decline in 2026 to roughly 650 million ounces, with photovoltaic demand falling more sharply.
Kitco, citing Metals Focus, reported a possible 19% decline in solar silver demand, to about 151 million ounces. That is a genuine bear factor. However, the market question is whether volume growth in solar installations and other industrial applications can offset the fall in silver intensity per unit.
The answer will depend on two variables:
- The rate of thrifting: How quickly manufacturers reduce silver use in each cell or module.
- The rate of deployment: How rapidly global solar capacity, electrification equipment and electronic hardware expand.
If installation growth remains strong, lower silver intensity may reduce demand without eliminating it. If solar growth slows at the same time as thrifting accelerates, the effect on the deficit could be more significant.
Why supply cannot respond quickly
Silver’s supply structure makes the metal different from a commodity dominated by primary mines.
Approximately 70%-75% of mined silver is produced as a by-product of lead-zinc, copper and gold operations, according to Silver Institute and World Silver Survey data. Only about one-quarter to one-third comes from mines where silver is the principal target.
That limits the immediate supply response to higher silver prices. A silver producer can expand output when grades, recovery rates and capital availability justify it. But a copper or lead-zinc mine generally makes its production decision according to the economics of the primary metal. A higher silver price may improve revenue, but it does not by itself create a new copper mine, extend a zinc operation or bring a polymetallic project into production.

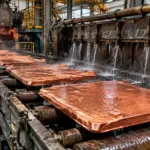
Refining and electrowinning infrastructure reflects the industrial complexity of silver supply.
The Silver Institute expects mine production and recycling to provide some additional material. Recycling is particularly price-sensitive: elevated prices can encourage the release of silverware, industrial scrap and other secondary sources. Even so, recycling is unlikely to eliminate the market’s structural dependence on above-ground inventories in the near term.
Base, bull and bear scenarios
These are reference bands rather than investment targets. They describe the conditions that could produce different silver-price outcomes as the market moves through 2026.
| Scenario | Reference price band | Conditions that could support it | Main risks |
|---|---|---|---|
| Bear | US$45-US$60/oz | Fed remains restrictive, the dollar strengthens, investment demand fades and solar thrifting accelerates | Persistent deficits may limit the depth and duration of the decline |
| Base | US$60-US$85/oz | Physical tightness persists, industrial demand remains historically high and the gold/silver ratio stays near 65:1-75:1 | Higher rates and inventory releases cap upside |
| Bull | US$85-US$120/oz | Further inventory drawdowns, renewed ETF and physical buying, geopolitical stress and ratio compression toward 50:1 | High prices accelerate substitution, recycling and demand destruction |
The gold/silver ratio provides a useful valuation framework without treating it as a stand-alone forecast. At a gold price of US$4,352.40:
- A 68:1 ratio implies silver of about US$64.01.
- A 75:1 ratio implies about US$58.03.
- A 60:1 ratio implies about US$72.54.
- A 50:1 ratio implies about US$87.05.
- A 90:1 ratio implies about US$48.36.
The current ratio near 68:1 has compressed significantly from above 90:1, showing silver’s recent outperformance. It has not, however, reached the more extreme historical levels associated with periods of intense silver speculation. Further compression would require silver to outperform gold again, likely through a combination of physical tightness and investment demand.
What operators and investors should watch
The most useful signals are physical and operational rather than headline price targets.
1. LBMA and COMEX inventories
Sustained inventory declines would indicate that deficits are continuing to draw on immediately available metal. Stabilization or rebuilding would suggest that recycling, mine supply, ETF outflows or weaker fabrication demand is relieving pressure.
2. Solar thrifting rates
The key measure is not only total solar capacity additions but silver use per cell or module. Faster thrifting could narrow the deficit even if installations continue to rise.
3. The Fed’s policy path
Silver has so far absorbed the September rate increase. A stronger dollar, higher real yields or further tightening could test that resilience. Conversely, any shift toward easier policy could reinforce investment demand.
4. Industrial restocking
Purchasing activity in electronics, autos, grid equipment and data-center supply chains will show whether industrial demand is merely slowing from exceptional levels or entering a broader contraction.
5. By-product mine economics
Copper, lead, zinc and gold prices will influence future silver supply. A sustained improvement in base-metal project economics could eventually raise by-product output, but permitting, construction and ramp-up timelines mean the response is unlikely to be immediate.
Silver’s central market tension is therefore clear. The metal is expensive enough to encourage substitution and recycling, but supply remains too dependent on other mining sectors to respond quickly. Until that balance changes, the price will continue to reflect not just demand growth, but the availability of bullion already above ground.
For related market context, see Skillings’ coverage of gold and silver market pressure and the broader minerals and metals sector.
Distribution snippets
LinkedIn:
Silver closed at US$64.15 an ounce as a sixth consecutive market deficit meets tighter physical inventories, industrial demand and a Fed that is still tightening. Our analysis maps the base, bull and bear cases : and explains why solar thrifting and by-product supply are the market’s key fault lines.
X:
Silver’s rally has held above US$64 despite a Fed hike and further tightening signals. The next move depends on inventories, solar thrifting, industrial restocking and a supply base dominated by by-product mines.