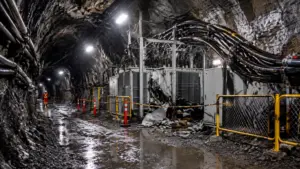
Copper smelter and converter equipment reflects the processing bottleneck created by scarce concentrate.

By Salini Krishnan
Copper’s 2026 rally has moved from a price story to a supply-chain stress test. Three-month LME copper reached a record US$14,703 a tonne on Sept. 8, before easing to about US$14,065 a tonne by Sept. 14 as exchange inventories rose and uncertainty over U.S. tariffs unsettled traders.
The pullback has not removed the underlying pressure. LME warehouse stocks are down nearly 40% since late May, while Shanghai Futures Exchange inventories have fallen about 85% from their mid-March peak. At the concentrate stage, the 2026 miner-smelter treatment and refining charge benchmark has fallen to zero, with spot charges deeply negative as smelters compete for scarce feedstock.
That combination points to a market with little spare capacity. The question for operators, investors and policymakers is whether copper can sustain prices near record levels without bringing forward enough new supply to close the gap.

Copper market markers
The following indicators connect current price action with the longer-term supply outlook.

| Marker | Latest indication | Why it matters |
|---|---|---|
| LME three-month copper peak | US$14,703/t | Record price reached on Sept. 8 |
| LME three-month copper | About US$14,065/t | Sept. 14 level after tariff-related volatility |
| LME warehouse stocks | Down nearly 40% | Smaller exchange buffer since late May |
| SHFE inventories | Down about 85% | Sharp drawdown from the mid-March peak |
| 2026 annual TC benchmark | US$0/t | Lowest benchmark on record, according to Sprott and IEA reporting |
| Spot treatment charges | Deeply negative | Smelters are competing aggressively for concentrate |
| Global mined supply | Potential 2026 decline | Could be the first annual contraction in nearly a decade |
| IEA copper supply gap | About 25% by 2035 | Existing and announced mines fall short of primary supply requirements |
| Additional demand to 2040 | Roughly 7 million tonnes | Growth from grids, data centres, electric vehicles and other strategic uses |
The table is intended as a linkable market reference for tracking the copper squeeze as prices, inventories and concentrate availability change.
Why the concentrate market is flashing red
Treatment and refining charges, or TC/RCs, are among the clearest indicators of stress in the copper supply chain.

In a normal market, miners pay smelters to process copper concentrate. The charge compensates the smelter for converting concentrate into refined metal and is influenced by the availability of feedstock, smelting capacity and by-product credits.
That relationship has broken down. The annual benchmark for 2026 was settled at zero, compared with US$21.25 a tonne in 2025, while spot charges have moved deeply below zero.
Negative spot treatment charges indicate that smelters are willing to sacrifice conventional processing revenue to secure concentrate. The pressure is particularly significant because smelting capacity has continued to expand, especially in China, while mined supply has been constrained by disruptions, declining grades and project delays.
The International Energy Agency’s Global Critical Minerals Outlook 2026 identifies copper smelting as a strategic part of the wider critical-minerals system. The agency said the 2026 benchmark charge was the lowest ever agreed and that spot charges had remained negative as concentrate supply tightened.
This is not simply a sign that smelters are under pressure. It also suggests that the market’s binding constraint has shifted upstream, from processing capacity to mine production.

Copper concentrator infrastructure links mine supply to the smelter feedstock market.
Mine supply is struggling to respond to price
Copper’s price should, in theory, encourage more production. In practice, the response is slow.
Sprott analysis cited by The Northern Miner indicates that global mined copper output could fall in 2026 for the first time in nearly a decade. The pressure comes from a combination of operational disruptions, weaker Chilean production, declining ore grades and the long lead times required to develop new mines.
Sprott has also pointed to a first-half production decline and major disruptions at large operations, including Grasberg and Kamoa-Kakula. These events matter because the copper market has become less able to absorb lost tonnes. Inventories are fragmented across regions, while tariff and trade uncertainty can prevent metal from moving freely to the locations where it is most needed.
The result is a market where a moderate production disruption can produce a disproportionate price reaction. The move from US$14,703/t to approximately US$14,065/t shows that copper remains vulnerable to macroeconomic and policy-driven corrections. But the fall also occurred against a backdrop of depleted inventories and negative concentrate charges, limiting the evidence for a sustained supply-led reversal.
The structural gap is larger than the current price cycle
The IEA’s estimate of a roughly 25% copper supply gap by 2035 should not be read as a precise one-year deficit forecast. It compares expected mine supply from existing and announced projects with projected primary supply requirements.
That distinction is important. Copper can trade at high prices for several years while the industry works through a project pipeline that remains too small, too slow or too technically difficult to close the gap.
The IEA also sees roughly 7 million tonnes of additional demand growth by 2040, driven by grid expansion, data centres, electric vehicles, renewable power and industrial electrification. Electrical infrastructure is becoming a larger part of the demand base, reducing copper’s dependence on traditional construction and property cycles.
Recycling will provide some relief, but it cannot eliminate the need for new mine supply. Copper recycling rates are expected to rise, yet secondary metal depends on the availability of end-of-life material, collection systems and processing capacity. The near-term market still requires primary copper to meet demand growth.
Exploration is attracting capital and strategic attention
The exploration sector is responding to the higher price environment, although projects remain at different stages of technical and financial maturity.
In Western Australia, BOA Resources’ Ricci Lee prospect has reported intercepts including 14 metres at 2.49% copper and 15 metres at 2.25% copper. The prospect is part of the Neds Creek Copper Project and is being advanced as a high-grade target within the Murchison Copper Belt.
In Namibia, Kaoko Metals’ Chalkos project has more than 800 metres of mapped copper mineralisation at Donkey Hill. Work at the Otniel prospect has also identified broad, shallow visible copper zones, supporting further drilling across the Donkey Hill-Otniel corridor. The company has raised capital to accelerate exploration.

Exploration drilling is targeting new copper systems as existing mines face declining grades.
In Nunavut, White Cliff Minerals’ Rae project has reported 90 metres at 4% copper at Danvers One. The company has also announced a A$8.77 million placement to Hancock Prospecting, which would give Hancock an estimated 13.5% stake, subject to shareholder approval. The proceeds are intended to support resource definition and step-out drilling across the Danvers discoveries and surrounding targets.
Elsewhere in Western Australia, Solstice Minerals’ Nanadie project is being advanced through a large drilling campaign focused on a broad copper-gold system. The project already has an inferred resource, while deeper drilling has extended mineralisation beyond the existing resource boundary.
RareX is also adding copper exposure through a 1,500-metre diamond drilling program at the Canobie Copper Project in Queensland. The program is following up copper and gold mineralisation at the Charcoal Bore and Alcala prospects.
These exploration results do not immediately solve the global supply gap. They do, however, show how high prices are changing the capital allocation environment for copper discoveries. Projects with established access, credible geology and scalable infrastructure are likely to attract greater strategic attention than early-stage targets without a clear development pathway.
Copper price scenarios
The following framework is designed to show how the main variables could shape the market. It is an analytical range rather than an investment recommendation or a precise price target.
| Scenario | Illustrative LME range | Key conditions | Market implications |
|---|---|---|---|
| Bear case | US$10,500–13,000/t | Global slowdown, improved mine output, easing tariff risk and weaker speculative positioning | Inventories stabilise, but structural deficits remain visible |
| Base case | US$13,000–15,000/t | Persistent concentrate tightness, limited mine response and resilient grid and data-centre demand | Pullbacks remain possible, but prices stay historically elevated |
| Bull case | Above US$15,000/t | Further mine disruptions, deeper inventory depletion, new trade restrictions or stronger electrification demand | Physical premiums rise and smelter stress intensifies |
The base case assumes copper remains volatile but structurally supported. The market does not need to reach a new record every week for the shortage narrative to remain intact. A sustained range around current levels would continue to strengthen project economics, encourage exploration and raise pressure on manufacturers to secure long-term supply.
The bull case would likely require another physical shock rather than simply stronger investor positioning. Further disruptions at major mines, accelerated inventory withdrawals or new restrictions on copper trade could push the market into a sharper squeeze.
The bear case is also credible over shorter periods. Copper remains exposed to global manufacturing, Chinese demand and policy-driven volatility. A material improvement in mine supply or a sharp economic slowdown could bring prices lower, even if the longer-term supply gap remains unresolved.
Outlook: high prices are buying time, not solving supply
Copper enters the next phase of the cycle with strong demand visibility but limited supply flexibility. The record price, depleted exchange inventories and zero treatment charge benchmark all describe different parts of the same problem: the industry is struggling to produce and process enough metal at the pace required by the energy transition.
The central risk is not that copper lacks demand. It is that high prices may arrive before new mines, expansions and processing infrastructure are ready to respond.
For operators, the focus will remain on grade control, reliability, permitting and project execution. For investors and policymakers, the more important question is whether the next wave of copper supply can move from exploration success to commercial production before the structural gap widens further.
Related Skillings coverage: Copper’s record run signals a deeper supply squeeze and copper price outlook and smelter fee analysis.
LinkedIn snippet
Copper’s record price is only one part of the story. LME three-month copper reached US$14,703/t, while LME and SHFE inventories fell sharply and 2026 treatment charges dropped to zero. With mined supply at risk of its first annual decline in nearly a decade and the IEA projecting a 25% supply gap by 2035, the market is testing how quickly new copper can be developed. Read the full analysis for the base, bull and bear scenarios.
X snippet
Copper hit US$14,703/t before easing to about US$14,065/t. LME stocks are down nearly 40% since late May, SHFE inventories 85% from their mid-March peak, and 2026 treatment charges are at zero. The squeeze is upstream, and new mine supply remains slow.