By Penny Langford

Gold mining’s cost base has moved beyond a threshold that once marked the upper end of the industry’s normal range. Global average all-in sustaining costs (AISC) reached approximately $1,785 an ounce in the first quarter, according to the World Gold Council, up 16% from a year earlier.
The milestone does not mean the sector has become unprofitable. Gold prices have risen much faster than production costs, leaving many producers with exceptional cash margins. It does mean, however, that the industry has less protection against a sustained fall in bullion prices, higher energy costs or operational disruption.
For operators and investors, the important question is no longer whether a mine is below or above $1,500 per ounce. It is how much margin remains after royalties, sustaining capital, labor, power, fuel and mine development are fully accounted for.
What all-in sustaining costs measure
AISC is a non-GAAP industry measure intended to show the recurring cost of maintaining current gold production. Under the World Gold Council’s framework, it generally includes:

- Mine-site operating costs
- Sustaining capital expenditure
- Sustaining exploration
- Corporate general and administrative costs
- Royalties and production taxes
- Reclamation and closure-related expenditures
AISC is different from the full cost of building a new mine. Major growth projects and non-sustaining expansion capital are normally excluded. The metric is therefore best used to compare the cost of maintaining existing production, not to estimate the total capital required for future supply.

By-product credits also complicate comparisons. Revenue from silver, copper or other metals can reduce reported AISC, while gold-equivalent reporting may produce a higher figure. Investors should check whether a company reports costs on an attributable, consolidated, gold-only or by-product basis.
The cost curve has shifted higher
The recent increase has been persistent rather than temporary. World Gold Council data show average global AISC rising from approximately $1,456 per ounce in early 2025 to $1,605 in the third quarter, $1,706 in the fourth quarter and roughly $1,785 in the first quarter of 2026.

That represents the sector’s 28th consecutive year-over-year increase in AISC, according to the council.
| Indicator | Reported level | Operating significance |
|---|---|---|
| Global average AISC | $1,785/oz | The production-weighted average is well above the former $1,500 threshold |
| Annual AISC change | +16% | Costs are rising despite strong gold prices |
| Quarterly AISC change | +5% | Pressure has continued in the near term |
| Royalties and production taxes | About 12% of AISC | Fiscal charges now represent a larger share of mine economics |
| Average AISC margin | About $3,076/oz | Gold prices have outpaced cost inflation |
| Higher-cost portion of the curve | Above $1,800/oz | These operations have less downside protection |
The figures are not directly comparable across every company or mine. But the direction is clear: $1,500 per ounce is now closer to the cost profile of a competitive producer than the industry average.
The World Gold Council’s AISC guidance remains the key reference point for understanding the measure and its limitations.
Why gold mining costs are rising
Royalties are capturing more of the price upside
Royalties and production taxes have become a larger cost of production as governments take a greater share of higher gold revenues.
The World Gold Council said royalty payments increased 24% quarter over quarter and 85% year over year in the latest period covered. In jurisdictions with sliding-scale royalty systems, the fiscal burden can increase sharply as gold prices rise.
That creates a distinction between the headline gold price and a mine’s realized economics. A higher bullion price increases revenue, but it can also increase royalties, employee profit-sharing payments, production taxes and land-access costs.
For investors, the relevant question is not simply whether gold is rising. It is how much of that increase remains with the operator after government charges and contractual obligations.
Fuel, power and consumables remain volatile
Gold mines are exposed to diesel, electricity, explosives, reagents, tires, maintenance parts and freight. Open-pit operations are particularly sensitive to fuel and haulage costs, while underground mines face heavy requirements for ventilation, pumping, ground support and development.
The World Gold Council reported significant increases in fuel and freight costs during the latest period, with regional diesel prices rising sharply. Disruptions to shipping lanes and energy markets can also affect mining consumables with a lag, meaning the full impact may not appear in AISC until subsequent quarters.
Large producers can partly reduce that exposure through fuel hedges, power-purchase agreements, inventory buffers and long-term procurement contracts. Smaller and single-asset operators generally have fewer options.

Underground mining requires sustained investment in development, ventilation, ground support and equipment.
Aging mines and lower grades add structural pressure
Many established gold mines are deeper, more complex or lower grade than they were earlier in their operating lives. As grades decline, operators must mine and process more tonnes to produce the same number of payable ounces.
That increases:
- Drilling, blasting and haulage requirements
- Grinding and processing energy use
- Equipment wear and maintenance
- Underground development
- Sustaining capital per ounce
A mine can therefore report stable production while its AISC rises because more material must pass through the operation to maintain output.
The same pressure can emerge at open-pit mines as strip ratios increase or ore zones become more difficult to access. At underground operations, declining grades may require longer development headings, additional ventilation and more complex ground-control systems.
Record margins mask uneven resilience
The sector remains highly profitable at current gold prices. The World Gold Council calculated average AISC margins of approximately $3,076 per ounce, up 25% sequentially and 134% year over year.
That calculation is straightforward:
AISC margin = realized gold price − all-in sustaining cost
But it should not be confused with net income or free cash flow. Taxes, interest expense, working-capital movements, non-sustaining capital, reclamation liabilities and corporate investment all sit outside the simple margin calculation.
The distribution across the cost curve matters more than the average.
A producer with AISC of $1,250 per ounce has a substantially different risk profile from one at $1,850 per ounce, even if both are generating strong cash flow today. The lower-cost operation can withstand a much larger decline in gold prices before it must defer capital, reduce output or reconsider mine plans.
A high-cost producer may still generate substantial cash at elevated gold prices, but its valuation and operating performance are more dependent on the metal remaining strong.

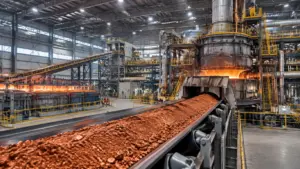
Processing capacity, maintenance requirements and power consumption can materially influence AISC.
Gold mining outlook: base, bull and bear cases
| Scenario | Gold-market conditions | Cost assumptions | Likely producer response |
|---|---|---|---|
| Base case | Gold remains historically high but below its recent peak | AISC rises moderately as labor, royalties and consumables stay elevated | Prioritize sustaining capital, debt reduction and selective brownfield growth |
| Bull case | Geopolitical risk and central-bank demand support further price strength | Energy and supply-chain costs stabilize | Expand exploration, accelerate development and increase shareholder returns |
| Bear case | Higher real rates, a stronger dollar or weaker investment demand pressure gold | Costs remain sticky near recent highs | Defer marginal projects, protect liquidity and focus on the lowest-cost zones |
The base case is the most useful framework for mine planning because it avoids treating exceptional margins as permanent. Projects that are economic only at record gold prices may face greater scrutiny, especially where construction requires high upfront capital or where permitting, infrastructure and labor risks remain unresolved.
The World Gold Council’s gold outlook identifies investment flows, central-bank demand, recycling and macroeconomic conditions as key variables for the price environment.
What operators and investors should monitor
The $1,500 milestone is best viewed as a starting point for analysis rather than a standalone warning signal.
1. AISC trajectory
A mine with AISC of $1,500 per ounce may be competitive if costs are stable or falling. The same mine becomes more concerning if AISC has risen rapidly for several consecutive quarters.
2. Cost composition
Companies should be assessed on the individual drivers behind AISC. A rise caused by temporary sustaining capital may be less concerning than a rise caused by declining grades, higher strip ratios or persistent labor shortages.
3. Royalty sensitivity
Investors should examine how much of a higher gold price is absorbed by royalties, taxes and profit-sharing schemes. Two mines with similar AISC may generate different cash flows because of their fiscal regimes.
4. Sustaining capital and free-cash-flow conversion
AISC includes sustaining capital, but reported free cash flow can still be affected by the timing of major maintenance projects, working-capital movements and non-sustaining investment.
5. Operational resilience
Fuel hedging, power security, equipment availability, water access, permitting and community relations can all affect production costs. Operational disruption can raise AISC quickly by reducing ounces while fixed costs remain in place.
6. Use of automation and data
Autonomous haulage, remote monitoring, predictive maintenance and improved ore control can help reduce energy consumption, equipment downtime and dilution. Technology is not a substitute for grade or sound mine planning, but it can improve resilience when cost pressure is persistent.

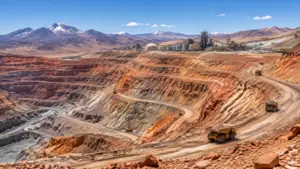
Mine scale, haulage distance and processing infrastructure shape the cost of every payable ounce.
The investor takeaway
Gold mining costs crossing $1,500 per ounce is a structural signal. It shows that higher gold prices are feeding into royalties, labor, energy, sustaining capital and contractor charges across the sector.
For now, price strength has more than offset cost inflation. Producers are generating exceptional margins and have greater flexibility to repay debt, fund exploration, invest in automation and return capital.
The risk lies in assuming those margins are permanent.
The strongest operators will use the current environment to improve mine plans, secure energy and supply contracts, maintain equipment and protect balance sheets. Higher-cost producers may continue to perform well while gold remains elevated, but they carry greater exposure to a correction, cost shock or operational interruption.
The most useful comparison is therefore not simply whether AISC is above or below $1,500 per ounce. It is whether a mine can remain economically viable across a range of gold prices, cost assumptions and operating conditions.
For broader sector context, see Skillings’ coverage of gold mining news and analysis, critical minerals and refining and autonomous mining technology.
Shareable social snippets
LinkedIn: Gold mining’s global average AISC reached approximately $1,785 an ounce, moving well beyond the $1,500 milestone. Royalties, energy, labor and sustaining capital are rising, but gold prices still support exceptional margins. The strategic test is whether producers convert today’s cash flow into stronger balance sheets and more resilient operations.
X: Gold mining costs have moved above $1,500/oz across much of the industry. Margins remain strong at current prices, but higher royalties, fuel, labor and sustaining capital are reducing downside protection. The key metric is no longer cost alone; it is resilience across the full gold-price cycle. #GoldMining #Gold #MiningFinance