Gold mining is entering a phase in which reserve replacement, cost control and project execution matter as much as headline production growth.

By Charles Pitts
Gold miners are adding ounces, but the latest reserve statements show that growth is becoming more dependent on near-mine drilling, resource conversion and higher capital spending than on large new discoveries.
That matters because global mined gold production reached a record 3,672 tonnes in 2025, according to the World Gold Council. The council expects only modest further growth as new projects take longer to permit, finance and build.
For operators and investors, the central question is no longer simply how many ounces a company reports. It is whether those ounces can be converted into mineable reserves, produced at a competitive cost and brought online within a credible schedule.
More Read

Reserve growth is increasingly a drilling story
A mineral reserve is the economically mineable portion of a measured or indicated resource after mining, processing, infrastructure, economic, environmental and other modifying factors have been applied. Resources are less certain and do not necessarily have demonstrated economic viability.

That distinction is important in a market where resource numbers can rise quickly while production remains years away.
Agnico Eagle provides a clear example of reserve replacement supported by sustained exploration. The company reported 55.4 million ounces of proven and probable gold reserves at the end of 2025, up 2.1% from the previous year. It said the increase replaced the 3 million ounces mined from operating assets, with additional ounces coming from the initial reserve declaration at Marban.
More Read

Agnico also reported:
- 47.1 million ounces of measured and indicated resources, up 9.6%.
- 41.8 million ounces of inferred resources, up 15.5%.
- About 1.4 million metres of drilling using an average of 120 diamond drill rigs during the year.
- A 2026 exploration and project budget midpoint of US$600 million.
The company’s reserve additions were not uniform across its portfolio. Meliadine added 496,000 ounces to reserves before depletion, while Fosterville replaced 101% of mining depletion. Kittila replaced 68% of depletion through conversion drilling.
The figures show why reserve replacement should be assessed at both portfolio and asset level. A company can report overall growth while individual mines continue to shorten their reserve lives.

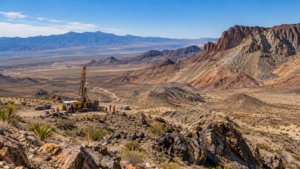
Underground drilling and development are central to converting resources into future production.
Large reserve bases can conceal portfolio changes
Newmont reported 118.2 million attributable ounces of gold reserves at the end of 2025, the largest reserve base among major gold producers. The figure was down from 134.1 million ounces a year earlier, but the company attributed 8.6 million ounces of the reduction to asset divestments.
Mining depletion accounted for another 7.2 million ounces, while negative revisions and cost escalation reduced the total further. Those impacts were partly offset by price-related revisions and resource conversion.
Newmont used a reserve gold-price assumption of US$2,000 per ounce, compared with US$1,700 the prior year. The company said a US$100 increase in the assumed gold price would lift reported reserves by approximately 5%, while a US$100 decrease would reduce them by about 2%, with other assumptions unchanged.
This sensitivity illustrates a wider industry issue: reserve growth is not purely geological. It also reflects metal-price assumptions, operating costs, recovery rates, exchange rates and mine plans.
A higher gold price can move material from resources into reserves, but rising wages, diesel prices, energy costs, sustaining capital or stripping requirements can move ounces in the opposite direction.
Costs are the second test of reserve quality
Gold miners have benefited from higher realized prices, but cost inflation remains a constraint. Recent company disclosures show that all-in sustaining costs, or AISC, vary significantly depending on mine depth, grade, energy exposure, labor requirements and sustaining capital.
Newmont reported 2025 gold AISC of approximately US$1,358 per ounce and guided to about US$1,680 per ounce for 2026. The increase reflects a portfolio that includes different operating jurisdictions, mine plans and capital requirements.
Agnico Eagle’s 2025 AISC was reported at approximately US$1,339 per ounce, supported by a relatively high-grade portfolio that includes underground assets such as Macassa and Kittila. By contrast, lower-grade open-pit operations can require larger mining movements and more material handling even when their reserve bases are substantial.
The practical implication is that reserve ounces should be read alongside:
- Reserve grade and mining method
- Processing recovery
- Strip ratio or underground development intensity
- Sustaining capital requirements
- Energy and labor exposure
- Permitting and closure liabilities
A large reserve measured at a low grade may provide scale but require higher capital and operating costs. A smaller, higher-grade underground reserve may support stronger unit margins but carry greater geological and development risk.
Project timelines remain the main supply bottleneck
The World Gold Council says the average discovery-to-production timeline for a gold mine can exceed 16 years. S&P Global Market Intelligence found that mines starting up between 2020 and 2023 took an average of 17.9 years from discovery to production.
The delay is not limited to construction. Permitting, environmental review, social consultation, feasibility work and financing can extend the period between a feasibility study and a final investment decision.
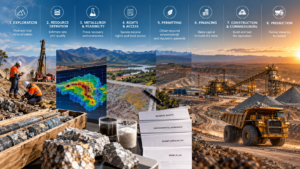
A useful working range is:
| Development stage | Indicative timing | Main risk |
|---|---|---|
| Discovery to resource definition | Several years | Geology and exploration success |
| Resource to prefeasibility | 2–5 years | Metallurgy, mine design and economics |
| Feasibility to permits and financing | 1–4 years | Approvals, capital and social license |
| Construction to first production | 1.5–3 years | Equipment, contractors and commissioning |
| Ramp-up to stable output | 3–12 months | Recovery, grade and plant performance |
These ranges overlap and vary widely. Projects with permits, financing and existing infrastructure can move faster. Remote projects, complex metallurgy or disputed approvals can take materially longer.
Osisko Development’s Cariboo Gold project illustrates the relatively short end of the construction phase. Its optimized feasibility study contemplated 24 months of construction, followed by a 10-month ramp-up, with first gold targeted for the second half of 2027, subject to financing and execution.
At Agnico Eagle’s Upper Beaver project, the company is advancing an exploration ramp and shaft rather than reporting near-term commercial production. It said the work could potentially bring initial production forward to early 2030, depending on drilling and bulk-sample results. That is a concrete milestone, but it remains contingent on technical studies and development decisions.
Scenario framework for operators and analysts
The following framework shows how reserve growth, cost pressure and schedule risk can interact. It is not a production forecast or investment recommendation.
| Scenario | Reserve outcome | Cost profile | Timeline impact | Primary signal to monitor |
|---|---|---|---|---|
| Base case | Near-mine drilling replaces most depletion | AISC rises moderately with labor, energy and sustaining capital | Existing projects advance broadly to plan | Reserve replacement near 100% and steady permitting |
| Bull case | Resource conversion exceeds depletion and adds higher-grade ounces | Grade and by-product credits offset inflation | Brownfield expansions move ahead of greenfield projects | Positive feasibility updates, funded construction and improving recoveries |
| Bear case | Depletion exceeds additions and reserves are revised lower | Cost escalation reduces mineable inventory | Permits, financing or construction delays push first production out | Reserve write-downs, weaker grades, rising AISC and delayed decisions |
The most important near-term milestone is not simply a reserve announcement. It is the point at which a project moves from geological potential to funded, permitted construction with a defined commissioning schedule.
That transition converts ounces in a technical report into a potential operating asset. Until then, resources and project studies remain exposed to changes in price assumptions, costs, metallurgy, permitting and capital availability.

Drill core data support resource conversion, but not every resource ounce becomes a reserve.
What to track in the next reporting cycle
For gold-mining professionals, five indicators provide a useful dashboard:
- Reserve replacement ratio: Did additions exceed depletion?
- Grade movement: Did reserve growth come from more tonnes, higher grade or price revisions?
- AISC trend: Are costs rising faster than production or realized prices?
- Capital allocation: Is exploration focused on near-mine conversion or high-risk greenfield work?
- Schedule credibility: Are permits, financing, engineering and construction progressing in sequence?
The sector’s production outlook remains constrained by the time required to convert discoveries into operating mines. The World Gold Council estimates that global reserves are roughly 54,770 tonnes under its methodology, while US Geological Survey estimates are closer to 64,000 tonnes. The difference reflects methodology, pricing and classification rather than a contradiction.
Those figures should not be read as a countdown to a fixed depletion date. Reserves can grow through exploration, technology, higher prices and improved mine planning. But the cost and time required to make those additions economic are becoming more important.
For the Operation 100K pipeline, that creates a durable editorial and analytical theme: gold supply is not disappearing, but new production is becoming more conditional. Reserve growth must be tested against cost resilience, project readiness and the credibility of the timeline from drill results to first gold.