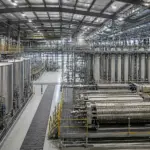
Copper smelter casting line in a modern industrial processing facility.

Copper’s 2026 outlook is being shaped by an unusual combination of tight concentrate supply, historically low smelter fees, uneven mine growth and new demand from power infrastructure and data centers. The result is a market in which a small refined surplus may coexist with severe pressure on smelter margins.
The most important milestone is the 2026 copper concentrate benchmark of $0 per metric ton for treatment charges and 0 cents per pound for refining charges, according to Reuters and industry reporting. That compares with $21.25 per ton and 2.125 cents per pound in 2025.
The benchmark does not determine the final copper price by itself. It does, however, show how aggressively smelters are competing for concentrate. The International Energy Agency has described the fee collapse as part of a wider strategic strain on the copper-processing system.
Copper price forecast: the market is divided
Published 2026 forecasts span a wide range. A Reuters analyst poll cited by market coverage places the average LME copper price near $11,975 per ton, while S&P Global Market Intelligence has put the average slightly above $12,100 per ton.
More Read

Other estimates are more cautious or more constructive:

| Forecast view | Indicative 2026 copper price | Main assumption |
|---|---|---|
| Bear case | $10,000–$11,000/t | Demand slows, inventories rise and mine supply performs better than expected |
| Base case | $11,500–$12,500/t | Concentrate remains tight, but refined output and recycling limit the deficit |
| Bull case | $13,000–$15,000/t | Mine disruptions, trade fragmentation and power-sector demand intensify |
| Higher-end published estimates | Above $13,000/t average | Strong infrastructure demand and persistent supply constraints |
These ranges are scenario markers rather than investment targets. J.P. Morgan’s copper outlook, for example, has described a strong midyear market with prices easing later in the year. Goldman Sachs has taken a more cautious view, pointing to the possibility of a refined surplus and a price range around $10,000–$11,000 per ton.
The disagreement reflects a central uncertainty: whether copper demand will grow fast enough to absorb incremental mine, scrap and refined production.
More Read

Zero smelter fees signal concentrate scarcity
Treatment charges and refining charges compensate smelters for converting copper concentrate into refined metal. When concentrate is plentiful, miners generally pay higher charges. When concentrate is scarce, smelters accept lower fees to keep their furnaces operating.
The 2026 China-linked benchmark has moved to zero, down sharply from the 2025 benchmark. Spot treatment charges in China have reportedly fallen below zero in some transactions, meaning smelters may effectively pay miners for access to concentrate before earning revenue from the refined copper.
That creates different outcomes across the supply chain:
- Integrated miners benefit from higher copper prices and can avoid some third-party processing costs.
- Custom smelters face margin compression and greater competition for feed.
- Traders must manage more complex regional pricing, freight and availability risks.
- Fabricators may face higher premiums even when exchange inventories appear adequate.
The benchmark is also not the same as every physical contract. Japanese, Korean and European smelters may negotiate different terms based on concentrate quality, freight, financing and contract structure. The key signal is the direction: concentrate availability is becoming more valuable than smelting capacity alone.

Copper mine and processing infrastructure in the Democratic Republic of Congo.
Mine supply is growing, but not quickly enough to remove risk
The latest International Copper Study Group forecast expects global mine production to grow by approximately 1.6% in 2026. Refined production is projected to increase by only about 0.4%, while refined copper usage is expected to rise by roughly 1.6%.
ICSG’s latest estimate points to a small refined surplus of approximately 96,000 tonnes. That is a much less comfortable balance than a large surplus, particularly in a market where regional trade flows can quickly remove metal from one consuming region and concentrate it in another.
The forecast has also changed materially. Earlier projections pointed to faster mine and refined growth, while later revisions reflected disruptions, slower demand and increased secondary production. That history illustrates why copper forecasts should be treated as moving frameworks rather than fixed numbers.
A key supply milestone is Kamoa-Kakula in the Democratic Republic of Congo. Ivanhoe Mines now expects 2026 copper production of approximately 290,000–330,000 tonnes, below its previous guidance of 380,000–420,000 tonnes. The company’s target to exceed 500,000 tonnes per year has shifted to 2028.
That delay does not remove Kamoa-Kakula from the supply pipeline. It does mean that a significant volume of expected growth arrives later than previously planned. The project’s revised schedule is an important indicator for the broader copper market because new large-scale mines are difficult to replace when construction or underground development slips.
Other projects and established operations face their own risks, including declining grades, water availability, power constraints, permitting delays and political intervention. Skillings’ coverage of the Mt Lyell copper restart illustrates the long lead time involved in returning brownfield capacity to production. Mt Lyell is targeting early 2029 production of approximately 26,000 tonnes of copper per year.
Demand is increasingly tied to electricity
Traditional construction and manufacturing remain important, but copper demand is becoming more closely linked to electricity networks.
Grid expansion, renewable generation, electric vehicles, charging infrastructure, industrial automation and data centers all require copper-intensive equipment. J.P. Morgan has estimated that data centers could use approximately 475,000 tonnes of copper in 2026, up from around 110,000 tonnes in 2025.
That estimate is significant, but it should be interpreted carefully. Data-center demand is only one component of global copper consumption, and actual usage will depend on construction schedules, power availability and the pace of equipment deployment.
The wider energy system may prove more durable than any single technology theme. Transmission upgrades and distribution networks require years of investment, while utilities and governments are increasingly focused on grid resilience and domestic supply chains.
This is why copper demand could remain firm even if parts of the property or consumer-electronics markets weaken. The market is becoming more exposed to long-term infrastructure spending as well as short-term industrial cycles.

Copper wire rod and processing equipment at an industrial fabrication plant.
Bear, base and bull cases
The following framework links price outcomes to physical market conditions:
| Scenario | Copper price range | Market balance | Smelter fees | What would drive it |
|---|---|---|---|---|
| Bear | $10,000–$11,000/t | Surplus widens | Fees recover from extreme lows | Weaker Chinese demand, higher scrap supply and fewer mine disruptions |
| Base | $11,500–$12,500/t | Small surplus or near balance | Benchmark remains near zero; spot fees stay weak | Moderate demand growth, delayed projects and constrained concentrate |
| Bull | $13,000–$15,000/t | Deficit develops | Spot fees move further negative | Supply disruptions, tariff-driven stockpiling, strong grid spending and data-center growth |
The base case is the most balanced interpretation of current public forecasts. It recognises that ICSG expects a small surplus while also allowing for the possibility that regional shortages and low concentrate availability keep prices above historical averages.
The bear case would require more than a single weak demand print. It would likely involve a combination of higher scrap collection, improved mine performance, rising refined production and a release of exchange or private inventories.
The bull case would depend on a renewed supply shock or a sustained trade-flow disruption. A regional shortage can lift prices even when the global market is technically in surplus, particularly when metal is concentrated in warehouses that are not easily accessible to other consumers.
What operators and investors should monitor
Several indicators will help determine which scenario is developing:
- Spot treatment charges: Further declines would confirm that smelters remain short of concentrate.
- Mine guidance: Revisions at large operations can quickly change global supply assumptions.
- Refined production: Watch whether constrained concentrate reduces smelter output despite available capacity.
- Scrap flows: High prices typically encourage recycling, which can moderate primary supply pressure.
- Regional premiums: U.S., European and Asian premiums may diverge as trade routes change.
- Inventory location: Total stocks matter less than whether metal is available to nearby consumers.
- Power-sector investment: Grid and data-center construction will help determine whether demand forecasts hold.
Skillings’ copper market intelligence coverage also examines how commodity prices are translating into project finance, M&A activity and valuation.
Bottom line
The 2026 copper market is not defined by one number. It is defined by the interaction between price, concentrate availability, smelter economics, mine timing and demand quality.
The zero-dollar treatment-charge benchmark is the clearest milestone so far. It indicates that smelters are competing intensely for feed, even as some forecasts still show a small refined surplus. At the mine level, Kamoa-Kakula’s delayed 500,000-tonne milestone demonstrates how quickly large supply additions can move beyond the forecast horizon.
A reasonable working range is $11,500–$12,500 per ton, with risks on both sides. Prices could move lower if demand weakens and inventories rebuild. They could rise sharply if mine disruptions, tariff-related stockpiling and electricity-sector demand tighten the physical market simultaneously.
For operators, the priority is protecting margins, securing concentrate and controlling project execution. For investors and policymakers, the more useful question is not whether copper is expensive, but whether the industry can deliver enough reliable supply at the pace required by the energy transition.