By Charles Pitts

Silver’s price outlook is being shaped by a market that remains physically tight but increasingly exposed to industrial efficiency gains and interest-rate risk. The Silver Institute expects a sixth consecutive annual market deficit, while industrial users are reducing silver intensity in some applications, particularly photovoltaic manufacturing.
That tension leaves silver with a wide range of possible outcomes. Published institutional forecasts cluster broadly between the mid-$60s and $80 an ounce, while more bullish scenarios extend above $100 if physical availability tightens and investment demand returns. The central issue for mining operators and investors is whether continued demand from electronics, solar, vehicles and power infrastructure can outpace mine supply and recycling.
The supply-demand balance remains the starting point
The latest historical data show why the market continues to attract attention.
According to the World Silver Survey 2025, global mine production rose 0.9% to 819.7 million ounces in 2024. Industrial demand increased 4% to a record 680.5 million ounces, while total demand reached approximately 1.164 billion ounces.
More Read

Later Silver Institute data for 2025 point to a mixed picture. Mine production rose to about 846.6 million ounces, while industrial demand declined to roughly 657.4 million ounces. That decline does not mean silver has lost its industrial importance. Industrial applications still account for more than half of total consumption.

The figures also show why deficit estimates must be interpreted carefully. Forecasts vary depending on whether they include changes in inventories, recycling, exchange stocks and investment demand. HSBC has estimated a 2026 deficit of around 73 million ounces, while other Silver Institute-linked estimates have placed the shortfall closer to 46 million to 67 million ounces.
The numbers differ, but the operational conclusion is similar: supply is not expected to respond quickly enough to eliminate the market gap.
More Read

| Market indicator | Quantified reference point | Why it matters |
|---|---|---|
| 2024 mine production | 819.7 Moz | Establishes the recent production base |
| 2024 industrial demand | 680.5 Moz | Record industrial consumption in the World Silver Survey 2025 |
| 2025 mine production | 846.6 Moz | Higher output, supported partly by byproduct supply |
| 2025 industrial demand | 657.4 Moz | Lower than the prior record but still more than half of total demand |
| 2026 industrial demand forecast | About 642 Moz | HSBC expects further easing as manufacturers thrift and substitute |
| 2026 mine production forecast | About 848 Moz | Only modest growth from the 2025 level |
| 2026 deficit estimates | About 46–73 Moz | Range reflects different assumptions and methodologies |
Sources: Silver Institute, World Silver Survey 2025, and HSBC data reported by Yahoo Finance. Figures are rounded.
Mine supply cannot respond quickly to price
Silver’s supply profile makes the market different from commodities where production is more directly controlled by the price of the metal.
A large share of silver is produced as a byproduct of copper, lead and zinc mining. That means a higher silver price does not automatically lead to a rapid increase in output. New silver-bearing material may only reach the market when a base-metal mine expands, a processing plant is debottlenecked or a delayed project finally starts production.

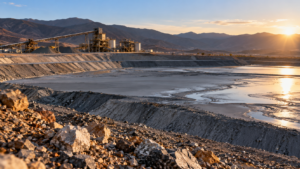
Underground mining infrastructure illustrates the capital and development timelines behind new supply.
New primary silver mines face the same constraints as other mining projects: exploration risk, permitting, construction costs, labour availability, water access, infrastructure and community engagement. Even when prices improve project economics, the response typically takes years rather than months.
The immediate supply response is more likely to come from existing operations. Producers may improve metallurgical recoveries, expand processing capacity, treat stockpiles or reassess underground extensions near existing infrastructure. For polymetallic mines, the value of silver credits can improve margins without requiring a new standalone silver project.
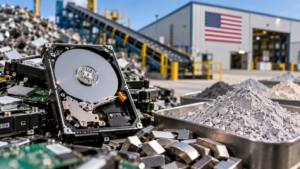
Recycling provides another source of flexibility. Higher prices can encourage recovery from jewellery, industrial scrap and discarded products. However, recycling flows are limited by collection systems and the economics of extracting small quantities of silver from complex equipment.
This slow response is the concrete milestone behind the current outlook: the market is approaching a sixth consecutive annual deficit even after mine production has increased. That milestone does not guarantee a sustained rally, but it shows why physical availability remains a key market variable.
Industrial demand remains large, but silver intensity is falling
Solar photovoltaics are central to the industrial demand debate. Silver is used in conductive pastes that collect and transfer electricity from photovoltaic cells. As solar installations expand, the sector has become a major source of silver consumption.
The relationship is changing, however. Manufacturers are reducing the amount of silver used per cell through finer screen printing, improved cell design, thrifting and substitution. As a result, solar capacity can grow while silver demand per unit of generation declines.

Solar manufacturing remains a major industrial demand source, although silver loadings are declining.
HSBC expects industrial silver demand to fall to about 642 million ounces, from approximately 657 million ounces in 2025. The bank has attributed the expected decline to lower silver intensity, softer demand in some manufacturing markets and continued substitution pressure.
That forecast should not be read as a collapse in industrial demand. Silver remains important in:
- Electronics and electrical equipment.
- Solar cells and power-generation systems.
- Electric vehicles and charging infrastructure.
- Data centres and communications equipment.
- Grid expansion and high-performance switches.
- Medical and specialist industrial applications.
The more important question is whether volume growth in these markets can offset efficiency improvements. If solar installations, electric vehicles and data infrastructure expand faster than manufacturers reduce silver use, industrial demand could remain resilient. If thrifting accelerates, demand may weaken even while the energy transition continues.
This is also relevant to the wider critical-minerals supply chain. Silver is not usually classified as a primary energy-transition metal in the same way as copper, lithium or nickel, but it supports the electrical systems that connect those markets. Its demand is therefore linked to the wider expansion of electrification.
Rates and the dollar can outweigh physical fundamentals
Silver is both an industrial metal and a monetary asset. That combination creates an additional source of volatility.
When real U.S. interest rates rise, the opportunity cost of holding a non-yielding metal increases. A stronger dollar can also make silver more expensive for buyers using other currencies. Those factors can reduce investment demand even when industrial users continue to purchase metal.
J.P. Morgan Global Research has projected an average silver price of about $70 an ounce, with a fourth-quarter estimate near $63. The bank cited softer solar-related demand, an easing of physical tightness and macroeconomic pressure.
HSBC has set a higher average forecast of approximately $75 an ounce, while noting that a narrowing deficit and weaker industrial and jewellery demand could limit sustained upside.
The market’s response to monetary policy is not mechanical. Higher rates can pressure silver, but persistent inflation, fiscal concerns or financial instability can increase demand for precious metals. Silver can also benefit when gold rallies, although its smaller and less liquid market often produces larger percentage moves in both directions.
Silver price prediction: scenario framework
The table below connects potential price ranges with the fundamental and macroeconomic conditions that could produce them. It is an analytical framework, not a direct price target or investment recommendation.
| Scenario | Indicative silver range | Conditions required | Key risk |
|---|---|---|---|
| Bear case | $55–$65/oz | Higher-for-longer U.S. rates, firm dollar, weaker industrial activity, faster solar thrifting and increased recycling | A physical shortage or rapid shift toward lower rates |
| Base case | $65–$80/oz | Continued deficit of roughly 46–73 Moz, resilient electronics demand, modest mine growth and mixed monetary policy | A sharper industrial slowdown or renewed investor liquidation |
| Bull case | $85–$110+/oz | Falling real yields, weaker dollar, renewed investment flows, supply disruption or a deeper physical deficit | Persistent high rates and accelerated substitution |
The base case assumes that the deficit supports prices without producing a sustained physical squeeze. It is broadly consistent with the range of published bank forecasts.
The bull case requires more than a supply shortfall on paper. It would likely need a financial catalyst, such as falling real yields, renewed exchange-traded fund demand or a rapid decline in available inventories. Silver’s relatively small market means that additional investment buying can have an outsized price effect.
The bear case does not require the market to move into a large surplus. Investment demand could weaken enough for prices to fall even while industrial users continue to consume silver. That is why the deficit should be treated as a medium-term support factor rather than a guaranteed short-term price floor.
What mining companies should monitor
For producers, the headline silver price is only one part of the margin equation. Operators should also track:
- Recovery rates: Small improvements can add material ounces without new mining faces.
- Byproduct exposure: Copper, lead and zinc output can determine silver availability.
- Energy and labour costs: High prices do not automatically produce stronger free cash flow.
- Processing constraints: Mill capacity and concentrate treatment can limit payable production.
- Recycling flows: Higher scrap supply could narrow the deficit.
- Solar loadings: Demand per cell may matter as much as total solar installations.
- Real yields and the dollar: These remain important drivers of investment demand.
- Inventory levels: Regional shortages can amplify price movements.
Existing mines may be better positioned than new projects to benefit from higher prices because they can use established infrastructure. Brownfield expansions, plant debottlenecking and improved silver recovery may deliver value faster than greenfield development.
For project developers, the scenario table provides a practical stress-testing framework. A project that works only at the bull-case price may face financing and schedule risk. More resilient projects will retain acceptable cash flow under the base case while offering additional upside if supply tightens.
Outlook
Silver’s price prediction ultimately rests on the interaction of two very different forces. Mine supply is slow-moving and heavily dependent on base-metal production, while industrial demand is supported by electrification but constrained by technological efficiency. Financial conditions can then overwhelm both forces in the short term.
The most defensible outlook is a volatile market with prices supported by a continuing deficit but vulnerable to higher real yields, a stronger dollar and weaker manufacturing demand. A sustained move above the base-case range would likely require both persistent physical tightness and a more supportive monetary environment.
For mining operators, the priority is converting higher prices into durable operating performance through recovery improvements, disciplined capital allocation and careful control of costs. For investors and policymakers, the key question is whether the next increment of silver supply can arrive before industrial demand and physical inventories place additional pressure on the market.
Sources and further reading
- Silver Institute: Silver supply and demand
- World Silver Survey 2025
- J.P. Morgan Global Research: Silver prices
- HSBC silver forecasts and supply-demand outlook
- Skillings: Silver price prediction, deficit, rates and industrial demand
- Skillings: Silver price prediction, drivers, scenarios and risk
- Skillings: Copper price forecast and market scenarios