The global mining sector demonstrated remarkable fortitude in the face of escalating geopolitical tension during the first quarter of 2026. While broader equity markets grappled with volatility stemming from persistent Middle East conflicts, the world’s top 50 mining companies saw their aggregate market capitalization surge by approximately $250 billion. This growth propelled the collective valuation of the industry’s leaders to a formidable $2.4 trillion – April 11th, 2026.

This resilience is not merely a byproduct of higher commodity prices. It reflects a fundamental shift in how institutional investors view the extractive industries: no longer just as cyclical plays, but as the essential infrastructure providers for both the energy transition and global security. As Q1 concluded, the “Mining.com Top 50” rankings revealed a sector that is leaner, more technologically integrated, and increasingly bifurcated between those capturing the “green premium” and those struggling with regional instability.
The $100 Billion Club: A New Hierarchy
The most significant development in the Q1 2026 rankings was the expansion of the “100 Billion Club.” For the first time in several cycles, six companies now hold a market capitalization exceeding $100 billion. This elite group is led by the traditional titans BHP and Rio Tinto, but it now includes a diverse array of geographic and commodity focuses.
Zijin Mining and Southern Copper have solidified their positions within this bracket, buoyed by the insatiable demand for copper. However, the standout performers were the gold majors. Newmont and Agnico Eagle both crossed the twelve-figure threshold this quarter, a direct result of gold’s ascent as a primary hedge against currency devaluation and geopolitical risk.

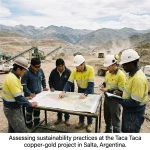
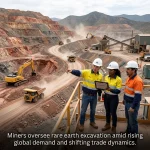
Caption: Global operations expanded in Q1 as the world’s largest mining companies added $250 billion in collective value.
More Read

Agnico Eagle’s performance has been particularly noteworthy. By maintaining a disciplined focus on low-risk jurisdictions, the company has attracted capital fleeing more volatile regions. This trend is analyzed deeply in our look at the Skillings Power List of companies dominating the energy transition, which highlights how operational stability has become a primary valuation driver in 2026.

Market Performance: Winners and Losers
While the overall market cap rose, the gains were not distributed evenly. The first quarter of 2026 was a story of operational excellence versus jurisdictional risk.
Top Performers: Glencore and Agnico Eagle
Glencore staged a significant comeback in Q1. After a period of transition, the company’s unique mix of marketing prowess and industrial assets allowed it to capitalize on disrupted supply chains. Meanwhile, Agnico Eagle’s record-breaking gold production: mirrored by peers like Torex Gold, which reported over 100,000 ounces of AuEq production in Q1: made it a favorite for investors seeking safety.
More Read

Underperformers: Amman Mineral and Ivanhoe Mines
On the opposite end of the spectrum, Amman Mineral and Ivanhoe Mines faced significant headwinds. Despite possessing world-class assets, Ivanhoe was buffeted by shifting regional dynamics in Central Africa, leading to a temporary cooling of investor sentiment. This highlight the “Resource Nationalism” risks that we detailed in our report on the new rules of West African mining.
| Company | Q1 Performance (Est.) | Market Cap Range | Primary Driver |
|---|---|---|---|
| BHP | +6.2% | >$150B | Iron Ore & Copper Stability |
| Agnico Eagle | +18.4% | >$100B | Record Gold Prices |
| Glencore | +12.1% | >$85B | Trading Margin Expansion |
| Ivanhoe Mines | -9.5% | <$20B | Jurisdictional Volatility |
| Zijin Mining | +10.8% | >$100B | Strategic Copper Acquisitions |
Commodity Drivers: Gold and Uranium Lead the Charge
The primary engine behind the $250 billion surge was the unprecedented performance of precious metals. Gold prices reaching $4,500 per ounce redefined the economics of the sector. The reasons for this spike: including the “Iran Pause” and strategic central bank buying: are examined in our Gold Price Analysis.
Beyond gold, uranium has emerged as the sleeper hit of Q1 2026. Spot prices reached $94.28 per pound by late January, a two-year high driven by a “nuclear renaissance.” Technology giants are now entering nuclear energy procurement directly to power massive AI data centers, decoupling uranium demand from traditional utility cycles. This surge has breathed new life into producers and explorers alike, particularly those hitting milestones in North America, such as Energy Fuels in Utah.

Caption: Trading floor boards reflected a sea of green for mining majors as commodity prices hit multi-year highs in early 2026.
Copper, while facing some volatility, remained resilient due to its critical role in the green transition. The “digital brain” of the industry is also playing a role; companies like Codelco are leveraging AI through partnerships with Microsoft to squeeze more efficiency out of aging pits, a trend that is becoming essential as ore grades decline globally. You can read more about this in our update on Codelco and Microsoft’s 2026 outlook.
Geopolitical Resilience and Strategic Reserves
The $2.4 trillion market cap resilience is also a reflection of heavy government intervention. In Q1, the industry saw the fruition of several major policy shifts. The European Union’s $50 billion critical minerals reserve plan began to influence project financing, providing a safety net for companies operating within the bloc’s sphere of influence.
Similarly, the United States doubled down on its own domestic supply chain. New funding bills introduced in early 2026 are designed to move projects through the permitting phase faster than ever before. For an in-depth look at these legislative changes, see our report on U.S. funding bills and project timelines.

Caption: Policy and defense funding have become critical factors in de-risking mining projects during the 2026 geopolitical shift.
Technology: The Efficiency Imperative
Resilience in 2026 is as much about cost control as it is about price. As labor shortages persist and energy costs remain high, the adoption of autonomous haulage and DLE (Direct Lithium Extraction) technology has accelerated. Albemarle’s $3.1 billion DLE pivot in the Atacama is a prime example of a major producer choosing efficiency over raw scale. This move is part of a broader industry trend toward optimizing the future through technology.
Furthermore, the autonomous haulage revolution is no longer a pilot program; it is a requirement for staying competitive in the “Top 50.” Caterpillar’s MineStar system and similar technologies are winning the 2026 efficiency race by significantly lowering the cost per ton in deep-pit operations.
Q2 2026 Outlook: What to Expect
As we move into the second quarter, several factors will determine if the $2.4 trillion valuation can be sustained:
- Base Metals Stabilization: While copper and aluminum saw gains in Q1, the sustainability of these prices depends on China’s industrial recovery and the pace of the global “Green Revolution.”
- Precious Metals Consolidation: After the meteoric rise of gold in Q1, some consolidation is expected. However, any escalation in the Middle East will likely keep a high floor under prices.
- M&A Activity: With $250 billion in added value, the balance sheets of the “Big 50” are flush with cash. Expect a wave of consolidation as majors look to acquire high-grade copper and lithium assets in “safe” jurisdictions.
The first quarter of 2026 has proven that the mining industry is no longer a bystander to global events: it is the bedrock upon which the modern world is navigating crisis. For operators and investors, the message is clear: resilience is built on a foundation of technology, strategic policy alignment, and geographic discipline.
Upcoming Industry Intelligence:
Don’t miss our ‘2026 Lithium Power Map’ presale – a comprehensive guide to the projects and policies shaping the next decade of battery metal supply.