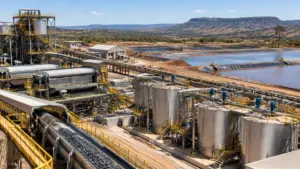
The Zgounder silver mine in Morocco sits within the arid Anti-Atlas mountain range.

Silver entered late September with the market focused on a familiar question: can a metal trading near $66 an ounce sustain its advance when investment flows are doing much of the work?
COMEX silver rose 1.21% in one late-September session and continued testing the $66-per-ounce level, while gold traded near $4,376 an ounce. At those prices, the gold-silver ratio was approximately 66:1, calculated by dividing gold by silver. The ratio remains well above the sub-50 level recorded earlier in 2026, but it is low enough to show that silver has retained substantial momentum relative to gold.
The next phase will depend on three competing forces: a continuing physical supply deficit, industrial demand that is shifting rather than simply growing, and the risk of a sharp retreat if speculative and retail investment demand reverses.
The silver price prediction 2026 therefore has to be framed as a range of outcomes rather than a single target.

Silver’s $66 test is taking place against a tight market
The Silver Institute, using research from Metals Focus, expects the global silver market to remain in deficit for a sixth consecutive year. Its 2026 outlook forecasts total supply of approximately 1.05 billion ounces, up 1.5% year over year.

Mine production is expected to rise 1% to about 820 million ounces, while recycling is forecast to exceed 200 million ounces for the first time since 2012. Even with those increases, the Silver Institute estimates a deficit of approximately 67 million ounces.
That shortfall matters because silver supply is unusually slow to respond to price signals. Only about 28% of mine production is expected to come from primary silver mines in 2026. The remaining output is largely produced as a by-product of gold, copper, lead and zinc operations.

A higher silver price can improve the revenue contribution from by-product material, but it does not automatically cause a copper or zinc mine to expand. Those decisions depend primarily on the economics, reserves and capital plans of the main commodity.
Silver market indicators
| Indicator | 2026 outlook | Why it matters |
|---|---|---|
| Total silver supply | About 1.05 billion oz | Forecast to reach a decade high, but still below demand |
| Mine production | About 820 million oz | Expected to increase roughly 1% |
| Recycling | More than 200 million oz | Forecast to rise 7% as high prices encourage scrap recovery |
| Primary silver share of mine output | About 28% | Limits the market’s direct response to higher silver prices |
| Industrial fabrication | About 650 million oz | Forecast to decline 2%, mainly because of solar thrifting |
| Physical investment | About 227 million oz | Forecast to rise 20%, offsetting weaker fabrication and jewelry demand |
| Market balance | About 67 million oz deficit | Sixth consecutive annual shortfall, according to the Silver Institute |
Sources: Silver Institute and Metals Focus, 2026 market outlook. Figures are forecasts and may be revised.
Zgounder adds a supply-side signal
The market’s attention is also turning to Morocco, where Aya Gold & Silver reported a high-grade exploration result at its Zgounder mine.
In a Sept. 16 release, Aya reported 783 grams per tonne of silver over 13 metres from surface in reverse-circulation hole ZG-RC-24-155 within the open-pit area. The company also reported higher-grade results from underground drilling, including a 3,501 g/t intercept over 3.5 metres.
The result does not immediately change global supply. Exploration intercepts must still be evaluated through additional drilling, resource modelling, mine planning and permitting. But it reinforces the geological potential of one of the few operations where primary silver production is expanding.
The Silver Institute has identified higher output from Zgounder as one of the contributors to Morocco’s expected production growth in 2026 as the mine completes its ramp-up. Aya’s Zgounder project information provides additional detail on the operation.

Exploration drilling helps define whether high-grade silver intercepts can support future resources.
The distinction between a strong drill result and marketable supply is important. A 783 g/t intercept can support resource growth and mine planning, but it does not guarantee an equivalent average grade across a deposit. Investors and operators will be watching follow-up drilling, recovery rates, dilution, mine sequencing and processing capacity.
Solar demand is falling, but electronics remain a support
Silver’s industrial demand story is becoming more complicated.
The Silver Institute expects industrial fabrication to decline by approximately 2% in 2026 to around 650 million ounces. The main reason is the photovoltaic industry, where manufacturers are reducing the amount of silver used per cell through thrifting and substituting other materials in some applications.
Silver Institute data cited in its 2026 outlook shows photovoltaic silver demand falling to roughly 151 million ounces, a decline of about 19%. That reduction is occurring even as global solar installations continue to expand.
The implication is that panel growth no longer translates one-for-one into silver demand. Improvements in cell efficiency, lower silver loadings and copper-based alternatives are weakening the relationship between solar capacity additions and silver consumption.

Solar manufacturing is expanding while silver use per cell declines.
Other industrial uses are providing some offset. Electrical and electronics demand is supported by data centers, artificial intelligence infrastructure, electric vehicles, 5G equipment and grid investment. Automotive silver demand is also expected to grow as vehicles use more electronic controls, sensors and connected systems.
That creates a shift in the demand mix:
- Solar: Larger installations but lower silver intensity.
- Electronics: Continued demand from data centers, AI systems and communications equipment.
- Automotive: Higher electronic content in EVs and advanced driver-assistance systems.
- Grid infrastructure: Silver use in electrical contacts, power systems and high-voltage equipment.
- Investment: Coins, bars and exchange-traded products remain the most important swing factor for price.
The result is a market where industrial fabrication can decline while total demand remains broadly stable because physical investment rises. The Silver Institute forecasts physical investment to increase 20% to approximately 227 million ounces in 2026.
Gold-silver ratio signals relative strength, not certainty
At gold near $4,376 and silver near $66, the gold-silver ratio is approximately 66.3. The ratio is calculated as:
Gold price ÷ silver price = gold-silver ratio
A falling ratio generally means silver is outperforming gold. A rising ratio means gold is outperforming silver.
The ratio is useful because silver combines monetary and industrial characteristics. Gold is more heavily driven by central-bank purchases, real yields, currencies and safe-haven demand. Silver responds to those factors too, but it also reacts to manufacturing activity, solar demand, electronics output and commodity-cycle expectations.
At 66:1, silver is not trading at the extreme relative strength implied by a ratio below 50. However, the current level shows that silver has held up while gold remained near historically high prices.
The ratio could fall further if:
- Gold remains supported near $4,300-$4,400.
- Silver investment demand continues to rise.
- Physical inventories remain tight.
- Industrial demand stabilizes outside photovoltaics.
It could rise sharply if:
- Gold holds while silver investment flows weaken.
- Solar thrifting accelerates.
- Manufacturing activity slows.
- Futures positioning unwinds.
Silver price prediction 2026: base, bull and bear cases
The following framework covers the remainder of 2026 and 2027. These are indicative trading ranges, not consensus forecasts or investment recommendations.
| Scenario | 2026 range | 2027 range | Main assumptions |
|---|---|---|---|
| Bear | $42-$58/oz | $38-$55/oz | Investment demand unwinds, real yields rise and industrial activity weakens |
| Base | $58-$78/oz | $60-$85/oz | Deficits persist, gold remains firm and electronics partly offset weaker solar demand |
| Bull | $78-$100/oz | $90-$125/oz | Physical tightness intensifies, ETF and retail flows accelerate, and gold moves higher |
Base case: $58-$78 in 2026 and $60-$85 in 2027
The base case assumes silver remains structurally undersupplied but does not experience another wave of speculative buying comparable to its strongest rallies.
Gold remains supported by central-bank demand and geopolitical uncertainty. Industrial fabrication stays mixed: solar demand declines because of thrifting, while electronics, automotive and grid applications grow.
Under this scenario, silver can hold above the low-$60s for extended periods but remains vulnerable to corrections toward the high-$50s.
Bull case: $78-$100 in 2026 and $90-$125 in 2027
The bull case requires investment demand to remain strong while physical inventories tighten further. A lower gold-silver ratio, renewed exchange-traded product inflows and a stronger gold market could push silver through the upper-$70s.
Supply would struggle to respond quickly because primary silver output is broadly flat and most mine production comes from operations targeting other metals. Higher prices could increase recycling, but that response may not be sufficient if investment demand accelerates at the same time.
Bear case: $42-$58 in 2026 and $38-$55 in 2027
The bear case is the clearest risk to any silver price prediction 2026. Silver’s market deficit does not prevent a sharp price decline if investment demand reverses.
A stronger dollar, higher real yields, weaker manufacturing activity and sustained outflows from exchange-traded products could overwhelm the physical deficit temporarily. Retail holders may also increase recycling and sell bars or jewelry into a falling market, adding secondary supply.
This scenario would not necessarily invalidate the long-term supply argument. It would show that silver prices are determined by both physical balances and financial positioning.
The key variable is investment demand
The late-September move toward $66 reflects more than industrial consumption. The Silver Institute expects physical investment to rise substantially, helping offset lower jewelry, silverware and photovoltaic demand.
That makes the market more sensitive to changes in sentiment. If investors continue adding exposure, even a modest deficit can be amplified by limited available inventories. If those investors sell, the same market can fall quickly because industrial users do not necessarily increase purchases at every price level.
This is why the Zgounder result matters in context. New high-grade resources can improve the medium-term supply outlook, but they cannot immediately replace above-ground inventory or respond to a sudden investment-driven rally.
For operators, the central questions are resource conversion, recovery, throughput and capital discipline. For investors and policymakers, the more important market indicators are physical premiums, exchange-traded holdings, recycling flows, solar silver intensity and production from copper, gold, lead and zinc mines.
Silver near $66 is testing the market’s ability to maintain momentum after a powerful advance. The structural deficit supports the longer-term case, but the range of outcomes remains wide. The most balanced conclusion is a base range of $58-$78 for the remainder of 2026 and $60-$85 in 2027, with a bull path above $100 and a bear path toward the low-$40s if investment demand unwinds sharply.