By Penny Langford

Global copper mine output is tracking toward its first annual decline since 2017, just as prices have reached levels once considered unlikely outside a severe supply shock.
Benchmark copper briefly touched a record US$14,875 per tonne before consolidating below US$14,100/t. The pullback has eased some speculative pressure, but it has not removed the underlying problem: the industry is struggling to deliver new metal while existing mines contend with declining grades, disruptions and rising operating complexity.
That combination is reshaping the copper price forecast 2026. The question is no longer simply whether copper demand will grow. It is whether mine supply can keep pace with electricity grids, data centers, defense infrastructure and broader industrial electrification.
A rare contraction in global mine supply
The International Copper Study Group has reported that global mined copper production fell approximately 1.1% year over year in the first half of the year. That decline has put full-year output at risk of contracting for the first time since 2017.

The weakness is concentrated in several major producing regions. Chile, the world’s largest copper producer, has continued to underperform, with lower output at aging operations and weaker production guidance from several companies. The country accounted for roughly 23% of global mine production in 2025, giving even modest changes in Chilean supply an outsized effect on the global balance.

The pressure is not limited to Chile. Disruptions at Grasberg in Indonesia and Kamoa-Kakula in the Democratic Republic of the Congo have removed substantial expected production. Sprott estimates that disruptions at major mines could eliminate roughly 600,000 tonnes of expected 2026 output, equivalent to about 2.5% of annual global mined supply.
A market that was expecting growth can absorb one major disruption. It has far less capacity to absorb several disruptions at the same time.

| Key figure | Market signal | Why it matters |
|---|---|---|
| Record copper price | US$14,875/t | Shows how aggressively the market is repricing scarcity |
| Recent consolidation zone | Below US$14,100/t | Indicates profit-taking and reduced speculative momentum |
| H1 global mine output | Down about 1.1% year over year | Places full-year production at risk of its first decline since 2017 |
| Estimated disruption impact | About 600,000 tonnes | Removes a material share of expected annual supply |
| China social inventories | About 14,875–14,100 tonnes in recent readings | Points to limited physical availability ahead of seasonal demand |
| New mine lead time | About 17 years | Limits the industry’s ability to respond quickly to high prices |
| 2026 annual TC benchmark | US$0/t | Shows how tightly smelters are competing for concentrate |
| Fund positioning reduction | About 16,000 long lots | Signals that some investors have reduced exposure after the price spike |
The inventory figures refer to market readings for Chinese social stocks, rather than a single exchange-reported category. They should therefore be interpreted as an indicator of local physical tightness, not as a complete measure of global copper availability.
Declining grades make high prices less powerful
Higher prices normally encourage producers to increase output. Copper is showing why that response can be slow and incomplete.
At mature mines, declining ore grades mean operators must move and process more rock to produce the same amount of copper. That raises energy use, water requirements, maintenance costs and capital intensity. It also makes production more vulnerable to equipment failures, weather events and technical interruptions.
Sprott has highlighted the pressure at major Chilean operations, including Escondida. Even with strong mining and processing throughput, lower grades are expected to reduce future production. Codelco, meanwhile, has faced several years of missed targets as it works through aging infrastructure and increasingly complex underground and open-pit projects.
The broader geological trend is even more important. The International Energy Agency has noted that the average global copper ore grade has fallen by roughly 40% since 1991. Brownfield expansion is also becoming more expensive, while major new discoveries are increasingly scarce.
This creates a structural distinction between price incentive and physical response. US$14,000 copper can improve margins immediately, but it cannot restore depleted grades or shorten the permitting and construction cycle for a new mine.

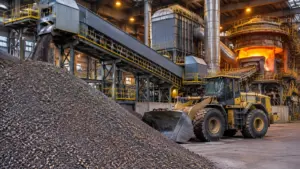
Copper ore moves through a modern processing circuit.
Sprott’s supply-squeeze thesis
Sprott’s analysis frames the current market as a structural supply squeeze rather than a conventional cyclical rally.
The thesis rests on four connected factors:
- Existing mines are underperforming.
- Ore grades are declining across mature districts.
- New projects require roughly 17 years from discovery to production.
- Demand is expanding through grids, artificial intelligence infrastructure and defense systems.
The squeeze is visible beyond mine output. Treatment and refining charges, paid by miners to smelters, have fallen to historic lows. The annual 2026 benchmark settled at US$0 per tonne, while spot charges have moved into negative territory in some markets.
That does not mean refined copper production stops immediately. Smelters can remain supported by by-products such as gold, silver and sulfuric acid, as well as refined copper premiums. But the collapse in treatment charges shows that smelters are competing for scarce concentrate.
The effect is a transfer of bargaining power toward miners. Producers with reliable concentrate may be able to negotiate stronger terms, secure financing more easily or attract partners for brownfield expansions. Custom smelters without captive feedstock face the opposite challenge: high copper prices do not guarantee healthy processing margins.
The IEA has warned that the existing project pipeline could leave the copper market facing a potential 30% supply deficit by 2035 under current assumptions. That long-range risk is one reason current prices have moved beyond the traditional “Dr. Copper” cycle narrative.
China’s low inventories meet a fragmented market
Chinese social inventories have become an important short-term signal. Recent market readings around 14,875 tonnes and 14,100 tonnes point to seasonal lows in stocks held across commercial warehouses, fabricators and traders.
Exchange inventories tell a similar story. SHFE stocks have fallen to their lowest levels in several years, while copper has also been redirected toward the United States in response to tariff uncertainty.
That relocation matters because copper can be globally abundant on paper while remaining scarce where manufacturers need it. US warehouse inflows have increased, but metal held in North America is not immediately available to a wire producer in China, a fabricator in Europe or a smelter elsewhere in Asia.
The result is a market increasingly divided by geography, trade policy and logistics. Regional premiums can rise even when total reported inventories appear comfortable.
This is also why the record price was followed by consolidation rather than an immediate collapse. The market is balancing two opposing forces: genuine physical tightness and a growing risk that high prices, policy delays or weaker industrial demand will release metal back into circulation.
Positioning has cooled, but the supply story remains
The reduction of approximately 16,000 long lots is an important counterpoint to the bullish supply narrative. After the move toward US$14,875/t, some funds reduced long exposure, locking in gains or lowering risk as prices entered a more volatile phase.
That repositioning does not necessarily invalidate the supply thesis. It shows that financial markets can move faster than physical markets. Speculators may reduce exposure within days, while a mine disruption, falling grade or delayed project can affect supply for months or years.
The distinction is important for interpreting price action. A decline in futures positioning can pressure copper in the short term, particularly if tariff expectations fade or the US dollar strengthens. But a lower speculative position does not create additional concentrate, restore Chinese inventories or bring a new mine into production.
The market therefore has two separate clocks: the financial clock, which can reverse quickly, and the project-development clock, which moves slowly.

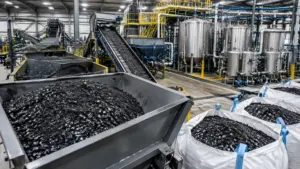
Copper cathodes are stacked inside a large-scale refining facility.
What the supply-decline year means for the industry
Producers
Existing producers are entering an unusually favorable margin environment, but the best-positioned companies will not necessarily be those with the largest resources. Operators that can maintain throughput, control costs and replace declining grades may capture more value than companies exposed to repeated outages.
High prices also improve the economics of mine extensions, brownfield projects, tailings recovery and improved recovery rates. Yet capital discipline remains important. A high copper price can make marginal projects appear attractive, but costs, permitting, power and water availability still determine whether production arrives on schedule.
Developers
For developers, the market is rewarding credible supply rather than simply large resources. Projects with existing infrastructure, established permits and access to processing capacity may attract more attention than technically ambitious greenfield deposits that remain years from construction.
The challenge is timing. A developer cannot assume that today’s record price will remain unchanged through a 10-year buildout. Financing models must account for cost inflation, schedule delays, community agreements and potential substitution by aluminum in selected applications.
Investors
The Cramer-esque investor takeaway is straightforward: watch the physical bottlenecks, not only the headline price.
A producer’s leverage to copper can be significant when prices rise, but so is its exposure to falling grades, cost overruns, labor disruptions and political risk. Developers offer longer-term supply exposure, but with greater execution uncertainty. Smelters may benefit from high refined copper prices while still suffering from depressed treatment charges.
The most useful indicators to monitor are mine guidance, treatment charges, Chinese inventories, exchange warehouse flows, scrap availability and progress at brownfield expansions.
Copper outlook: three scenarios
| Scenario | Market conditions | Likely outcome |
|---|---|---|
| Base case | Mine output remains flat to slightly lower, inventories stay tight and demand growth continues but unevenly | Copper consolidates at historically elevated levels with sharp regional premiums |
| Bull case | Further mine disruptions coincide with low Chinese stocks, stronger grid investment and renewed tariff-driven stockpiling | Prices retest or exceed the record as prompt metal becomes scarce |
| Bear case | Global manufacturing weakens, tariff expectations unwind, scrap supply rises and disrupted mines recover faster than expected | Copper corrects sharply, though long-term supply constraints remain |
For the copper price forecast 2026, the base case is not a straight-line rally. It is a high-volatility market in which physical tightness provides support while positioning, policy and demand shocks create abrupt reversals.
The more durable conclusion is that copper supply is becoming harder to grow. A first annual mine-output decline since 2017, record prices, low Chinese inventories and collapsing treatment charges are not isolated signals. Together, they describe a critical minerals supply chain operating with less spare capacity than the market had assumed.
Social snippet
LinkedIn/X: Copper has reached record prices just as global mine output heads toward its first annual decline since 2017. Falling ore grades, major disruptions, low China inventories and collapsing treatment charges point to a tighter critical minerals supply chain, but reduced fund positioning means volatility remains high. Read the full analysis of producers, developers and the copper price outlook.